Hi everyone,
I noticed than when I create subplots that have linked axes, labels are either missing or misplaced.
Here is a reproducible example:
import numpy as np
import plotly.graph_objects as pgo
import plotly.subplots as psp

fig = psp.make_subplots(
    rows=2, cols=2,
    row_heights=[.2, .8], column_widths=[.8, .2],
    horizontal_spacing=0.05, vertical_spacing=0.05,
)

x = np.random.randint(0, 100, 100)
y = np.random.randint(0, 100, 100)

fig.add_traces([

    pgo.Scatter(x=x, y=y, xaxis='x3', yaxis='y3', mode='markers'),

    pgo.Histogram(x=x, xaxis='x3', yaxis='y1'),
    pgo.Histogram(y=y, xaxis='x4', yaxis='y3'),
])

fig.update_layout(
    height=600,
    width=600,

    xaxis1=dict(title=dict(text='x1')),
    yaxis1=dict(title=dict(text='y1')),
    xaxis2=dict(title=dict(text='x2')),
    yaxis2=dict(title=dict(text='y2')),
    xaxis3=dict(title=dict(text='x3')),
    yaxis3=dict(title=dict(text='y3')),
    xaxis4=dict(title=dict(text='x4')),
    yaxis4=dict(title=dict(text='y4'))
)

fig
As you can see I linked the x3 with x1 and y3 with y4.
Here below you can see how the plot looks like. You can see that all labels for plot 2 are missing, as well as the x label for plot 1 and the y label for plot 4. Moreover, the x label for plot 4 is located on top and it is impossible to move it to the bottom (even adding the keyword side='bottom'.
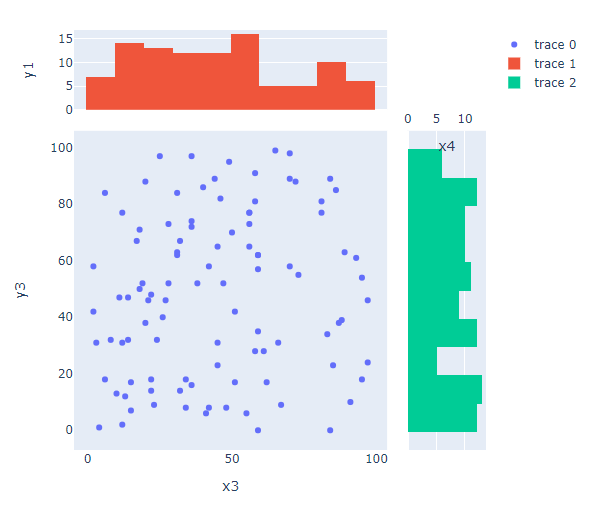
Can someone help me with this one. I am mostly interested in moving x4 to the bottom.
Thank you!