Hi Guys,
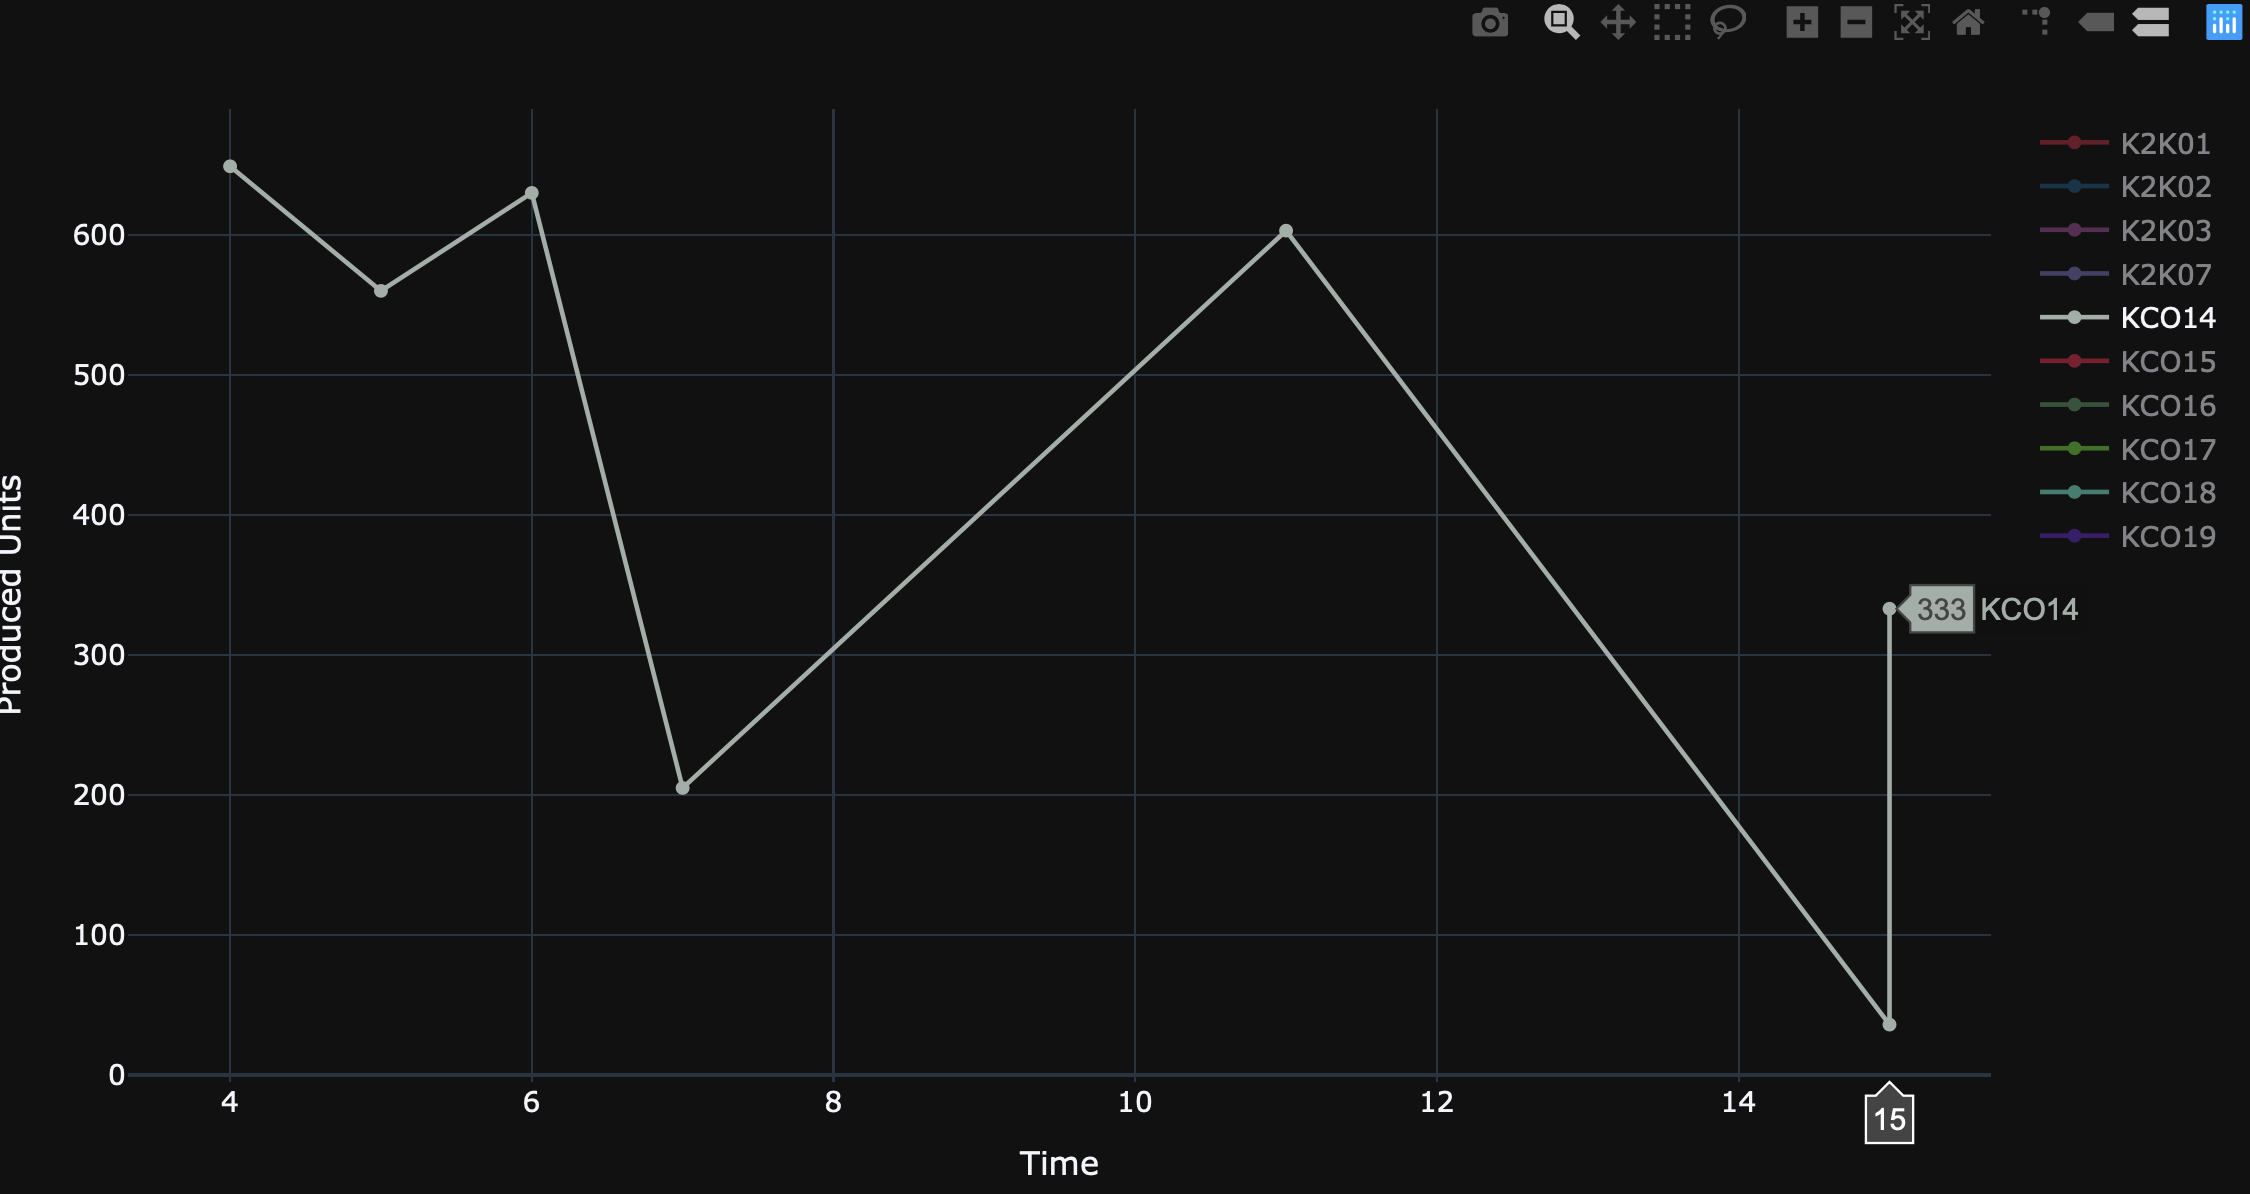
Could you please help me to avoid plots in the same “Time” for the same “Machine”.
I want to sum units produced for machines in tme same time and plot a unique pont. Could you please hel me.
This is my code.
import plotly.graph_objects as go
import pandas as pd
import random
get_colors = lambda n: list(map(lambda i: "#" + "%06x" % random.randint(0, 0xFFFFFF),range(n)))


df2 = pd.read_csv('df3.csv')

groups = df2.groupby(by='Machine')


data = []
colors=get_colors(50)

for group, dataframe in groups:
    dataframe = dataframe.sort_values(by=['Time'])
    trace = go.Scatter(x=dataframe.Time.tolist(),
                       y=dataframe.Units.tolist(),
                       marker=dict(color=colors[len(data)]),
                       name=group
                       )
    data.append(trace)

layout =  go.Layout(xaxis={'title': 'Time'},
                    yaxis={'title': 'Produced Units'},
                    margin={'l': 40, 'b': 40, 't': 50, 'r': 50},
                    hovermode='closest',
                   template='plotly_dark')

figure = go.Figure(data=data, layout=layout)
figure.show()