Audio file aligned with graph

Situation:
I have a plot and an audio-file from a device that need to interact in dash on a localhost.
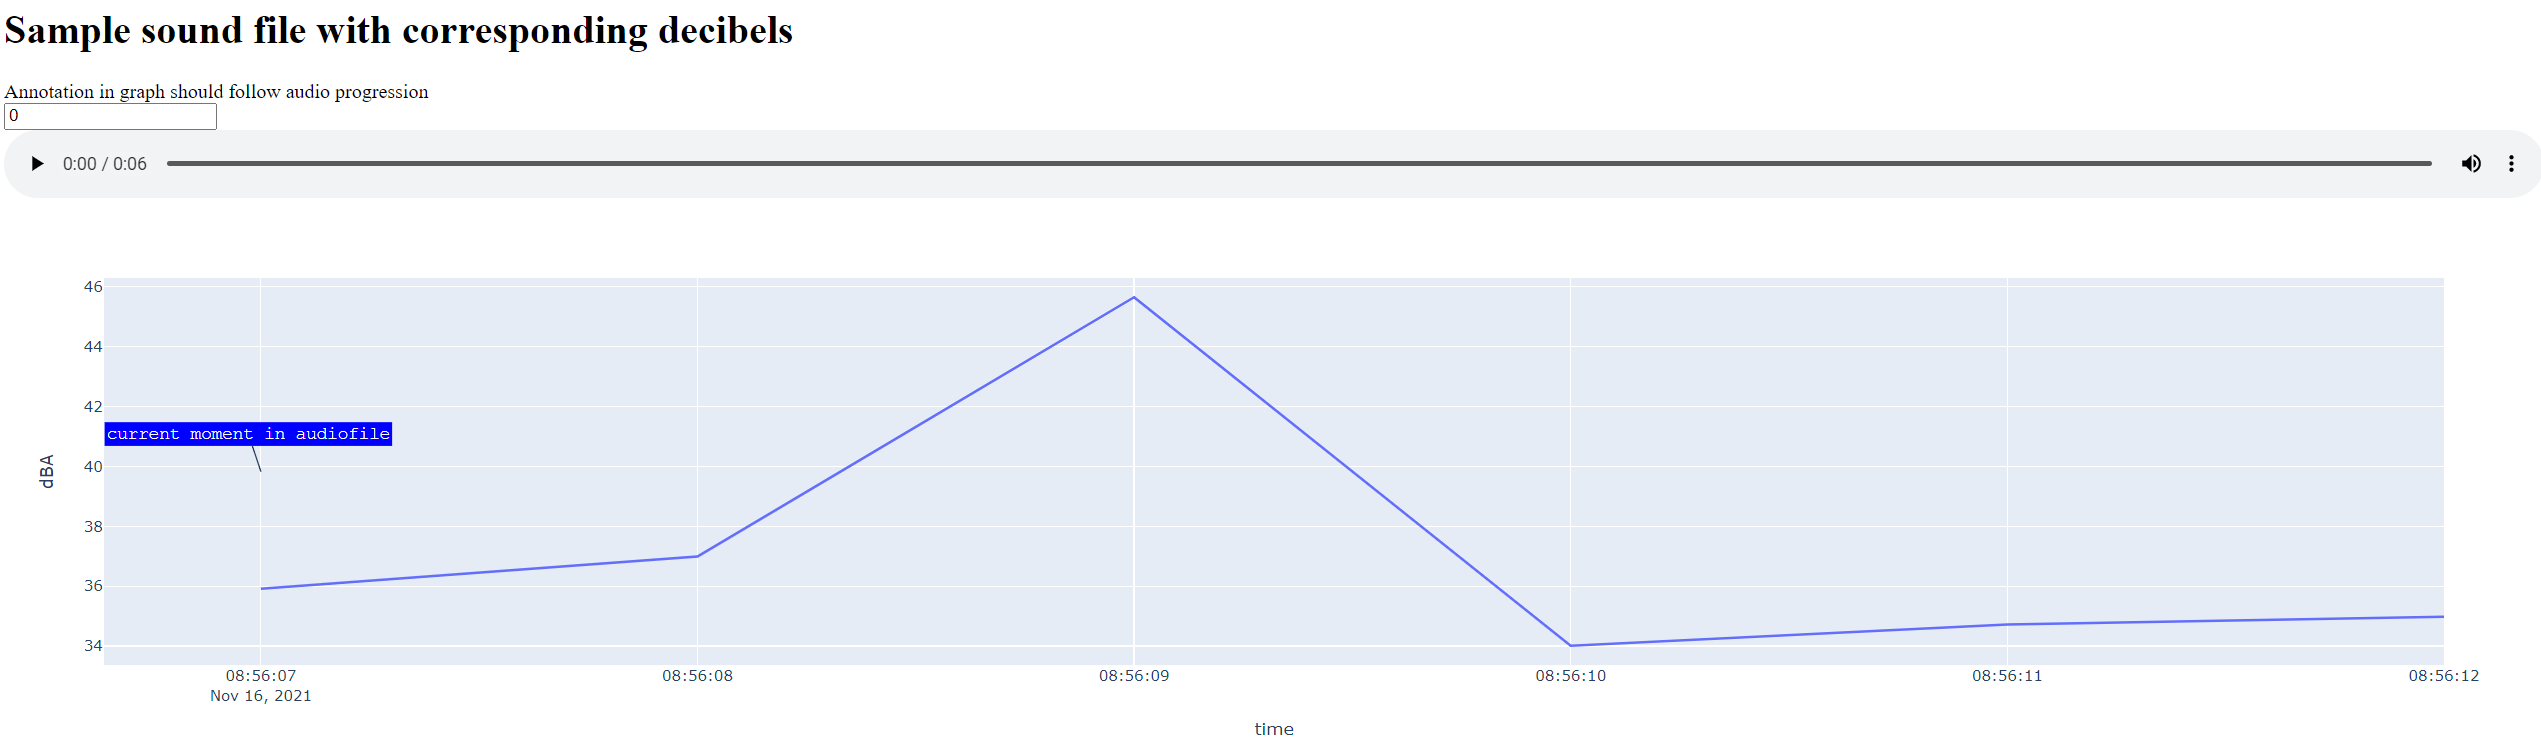
In dash, when playing the [audio] (dBA_sound.wav - Google Drive)-file, the annotation on the plot should move along the time - axis.
In that way, for example, the maximum decibels in the audio-file can be read from the plot.

I experimented with a simple dcc.input (textbox) to simulate the principle: by manualy incrementing the elapsed seconds in the text-box, the annotation moves in the plot.
So far the good news.

Question:
How can i catch the “Elapsed time” from the html.audio - component and pass it to the plot to update the annotation?

My code:

import dash
from dash import dcc, html, Input, Output
import plotly.express as px
import pandas as pd
import base64
import datetime


def create_fig_time_vs_db(x_plot_field: str, y_plot_field: str):
    """
    Creates a Plotly-express line chart figure with a time series of decibels
    :param
        x_plot_field: string, field name of x-axis -> time
        y_plot_field: string, field name of y-axis -> decibels
    :return: figure with time series
    """
    fig = px.line(df, x=x_plot_field, y=y_plot_field)
    return fig


def fig_add_annotation(fig, time_indication, txt_annot):
    """
    add an annotation on an actual moment of interest
    in a figure with a time series
    :param
        fig: Plotly express line chart figure
        time_indication: time object -> datetime.datetime(2021, 11, 16, 9, 0, 0)
        txt_annot: Annotation text
    :return: figure with time series and annotation
    """
    fig.update_annotations(visible=False)
    fig.add_annotation(
        x=time_indication,
        y=0.5,
        xref='x',
        yref='paper',
        xshift=0,
        text=txt_annot,
        showarrow=True,
        font=dict(family="Courier New, monospace", size=14, color="#ffffff"),
        align="center",
        bgcolor="blue",
    )
    return fig


# sample dataframe with decibels
df = pd.DataFrame({
    'time': ['2021-11-16 08:56:07', '2021-11-16 08:56:08', '2021-11-16 08:56:09',
             '2021-11-16 08:56:10', '2021-11-16 08:56:11', '2021-11-16 08:56:12'],
    'dBA': [35.91, 36.99, 45.65, 34.01, 34.72, 34.98],
    'marker': [0, 0, 1, 1, 1, 0]})
df['time'] = pd.to_datetime(df['time'])
begintime = df['time'].min()

# corresponding audio-file.
encoded_sound = base64.b64encode(open('dBA_sound.wav', 'rb').read())

# load figure without annotation
fig_time_vs_db = create_fig_time_vs_db('time', 'dBA')

# define dashboard
app = dash.Dash(__name__)
app.layout = html.Div(children=[
    html.H1(children='Sample sound file with corresponding decibels'),
    html.Div(children='Annotation in graph should follow audio progression'),
    dcc.Input(id="txt_seconds", value=0, type='number'),
    html.Audio(id='audioplayer', src='data:audio/mpeg;base64,{}'.format(encoded_sound.decode()),
               controls=True,
               autoPlay=False, style={"width": "100%"}
               ),
    dcc.Graph(id='timeseries', figure=fig_time_vs_db)])


@app.callback(Output('timeseries', 'figure'),
              Input('txt_seconds', 'value'))
def update_figure(value):
    elapsed_timeobject = begintime + datetime.timedelta(seconds=int(value))
    return fig_add_annotation(fig_time_vs_db, elapsed_timeobject, 'current moment in audiofile')


if __name__ == '__main__':
    app.run_server(debug=True)

Hi @ChironeX1976,

Welcome to the community! :slightly_smiling_face:

I don’t think html.Audio has an elapsed time prop, therefore you can’t get it in the same way you are doing with the input value.

On the other hand, this custom component seems to have a currentTime prop that you can use. I imagine that it can play audio files as well, but I never used it and I can’t say much about it…

Hope this comment at least put you in a good direction to figure out how to do it.

1 Like

Hi @ChironeX1976

With the html.Audio is it not possible to get the currentTime at the server-side but it is possible to do it with a app.clientside_callback and javascript.
HTML5 Audio element has a currentTime and duration property.
Link to w3schools Audio Property currentTime

Here a possible answer in code:

"""
sample code
"""

# IMPORTS -----------------------------------------------------------
import dash
from dash import dcc
from dash import html
from dash.dependencies import Input, Output

import plotly.express as px
import pandas as pd
import base64

# DATA --------------------------------------------------------------
data_file = "data/GL 22  007 (1)_LoggedBB.txt"
data_sound_file = "data/Dog Snarling.mp3"

# data sound preparations
data_sound = base64.b64encode(open(data_sound_file, 'rb').read())

# data table preparations
df = pd.read_csv(data_file, delimiter="\t", skiprows=0, engine="python", decimal=',')
df = df[['LAeq', 'Start Time', 'vreemd']]
df['Start Time'] = pd.to_datetime(df['Start Time'], format='%d/%m/%Y %H:%M:%S')

# MAIN --------------------------------------------------------------
app = dash.Dash(__name__, title="Audio analysis", update_title=None)

app.layout = html.Div([
    html.H1(children='-' + data_file),
    html.Div(id='client_content', children='DATA'),

    dcc.Store(id="client_fig_data", data={}),

    dcc.Interval(
        id="client_interval",
        interval=50
    ),

    html.Audio(id='audiospeler',
               src='data:audio/mpeg;base64,{}'.format(data_sound.decode()),
               controls=True,
               autoPlay=False,
               style={"width": "100%"}
               ),

    dcc.Dropdown(id='server_drp_marker',
                 options=[
                     {'label': 'Data: Vreemd', 'value': 'vreemd'},
                     {'label': 'Data: Lek', 'value': 'LAeq'}],
                 value='LAeq',
                 style={"width": "50%"}),

    dcc.Graph(id='client_graph')
])


# CALLBACKS ---------------------------------------------------------
# server-side callback make the figure and send it to the client.
@app.callback(
    Output('client_fig_data', 'data'),
    Input('server_drp_marker', 'value')
)
def update_figure(data_value):
    fig = px.line(df, x='Start Time', y=data_value)
    fig.add_annotation(
        x=0.2,
        y=0.5,
        xref='paper',
        yref='paper',
        xshift=0,
        text='position',
        showarrow=True,
        font=dict(family="Courier New, monospace", size=14, color="#ffffff"),
        align="center",
        bgcolor="red",
    )
    # print(fig) # debug the figure data
    return fig


# client-side callback with javascript to update graph annotations.
app.clientside_callback(
    """
    function TrackCurrentTime(figure_data, n_intervals){
        if(figure_data === undefined){
            return [{'data': [], 'layout': {}}, 'ERROR: no data for figure'];
        }
        
        var myaudio = document.getElementById("audiospeler");
        var cur_time = myaudio.currentTime;
        var tot_time = myaudio.duration;
        if( !tot_time ) {
            return [figure_data, 'ERROR: no data for sound'];
        }
        var ratio_time = cur_time / tot_time
 
        const fig = Object.assign({}, figure_data, {
            'layout': {
                ...figure_data.layout,
                'annotations': [{
                    ...figure_data.layout.annotations[0],
                    'x': ratio_time,
                    'text': parseFloat(ratio_time).toFixed(2)
                }]
            }
        });       
              
        return [fig, ratio_time];
    }
    """,
    Output('client_graph', 'figure'),
    Output('client_content', 'children'),
    Input('client_fig_data', 'data'),
    Input('client_interval', 'n_intervals')
)

if __name__ == '__main__':
    app.run_server(debug=True)

3 Likes

Thanks. this works.