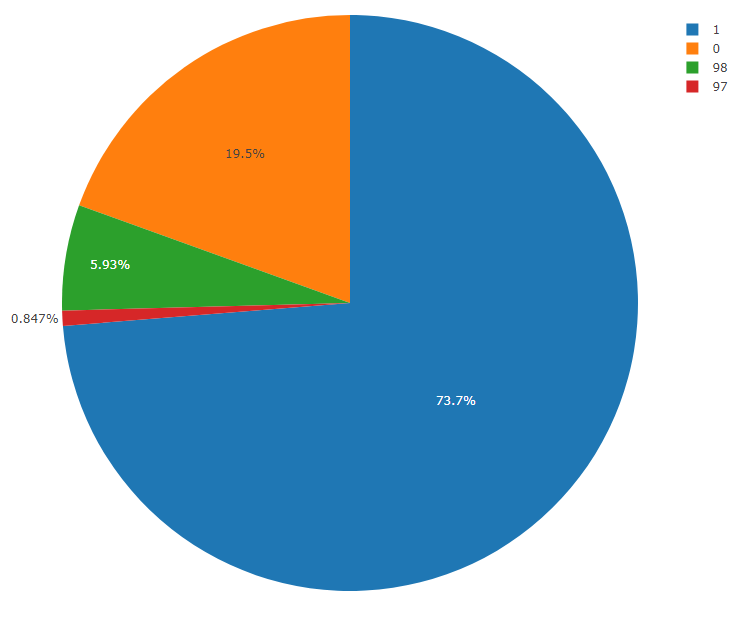
I have this frequency table displaying the answers of a survey question and their frequencies.
| x | freq | |
|---|---|---|
| 1 | 0 | 23 |
| 2 | 1 | 87 |
| 3 | 97 | 1 |
| 4 | 98 | 7 |
I have multiple of that kind (one for each question) and I want to plot them as an all-in-one facet plot which is why I’m using the following code:
fig <- plotly::plot_ly()
fig <- plotly::add_pie(data = df_count, labels = ~x, values = ~freq)
This results in the following error:
“Error in add_trace_classed(p, class = “plotly_pie”, values = values, labels = labels, :
argument “p” is missing, with no default”
Everything works fine when I try to generate the plot as follows:
fig <- plotly::plot_ly(data = df_count, labels = ~x, values = ~freq, type='pie')
In other forum threads similar errors occured when two packages were loaded which were sharing a common function. But since I’m writing a package, I’m already specifying all external functions that I use with the [pckg]::[fun] syntax…
Thx for your help!