I need to implement a CIELab color chart as in the following image using Plotly.js.
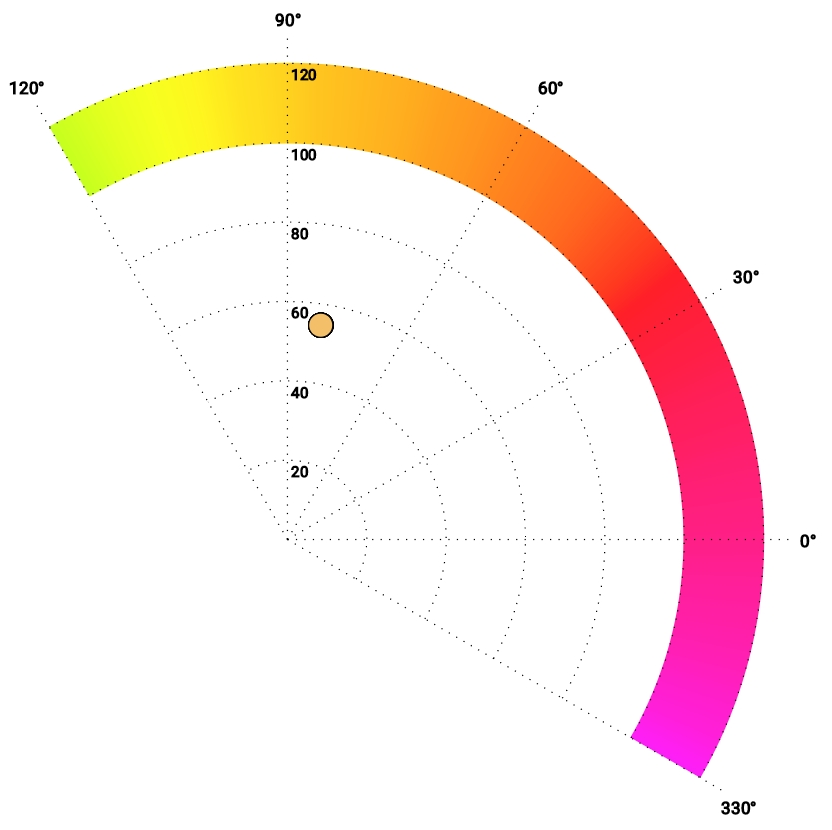
I tried to overlap : one drawing a sweep color backgrond, one with a circular mask to hide the corners, and one displaying a circle the size of the polar chart to have a donut shape. I then added the chart on top of them. This is however a clunky solution, so I was wondering if there is a way to achieve the same result using Plotly capabilities. I have searched the wen but did not find a solution.