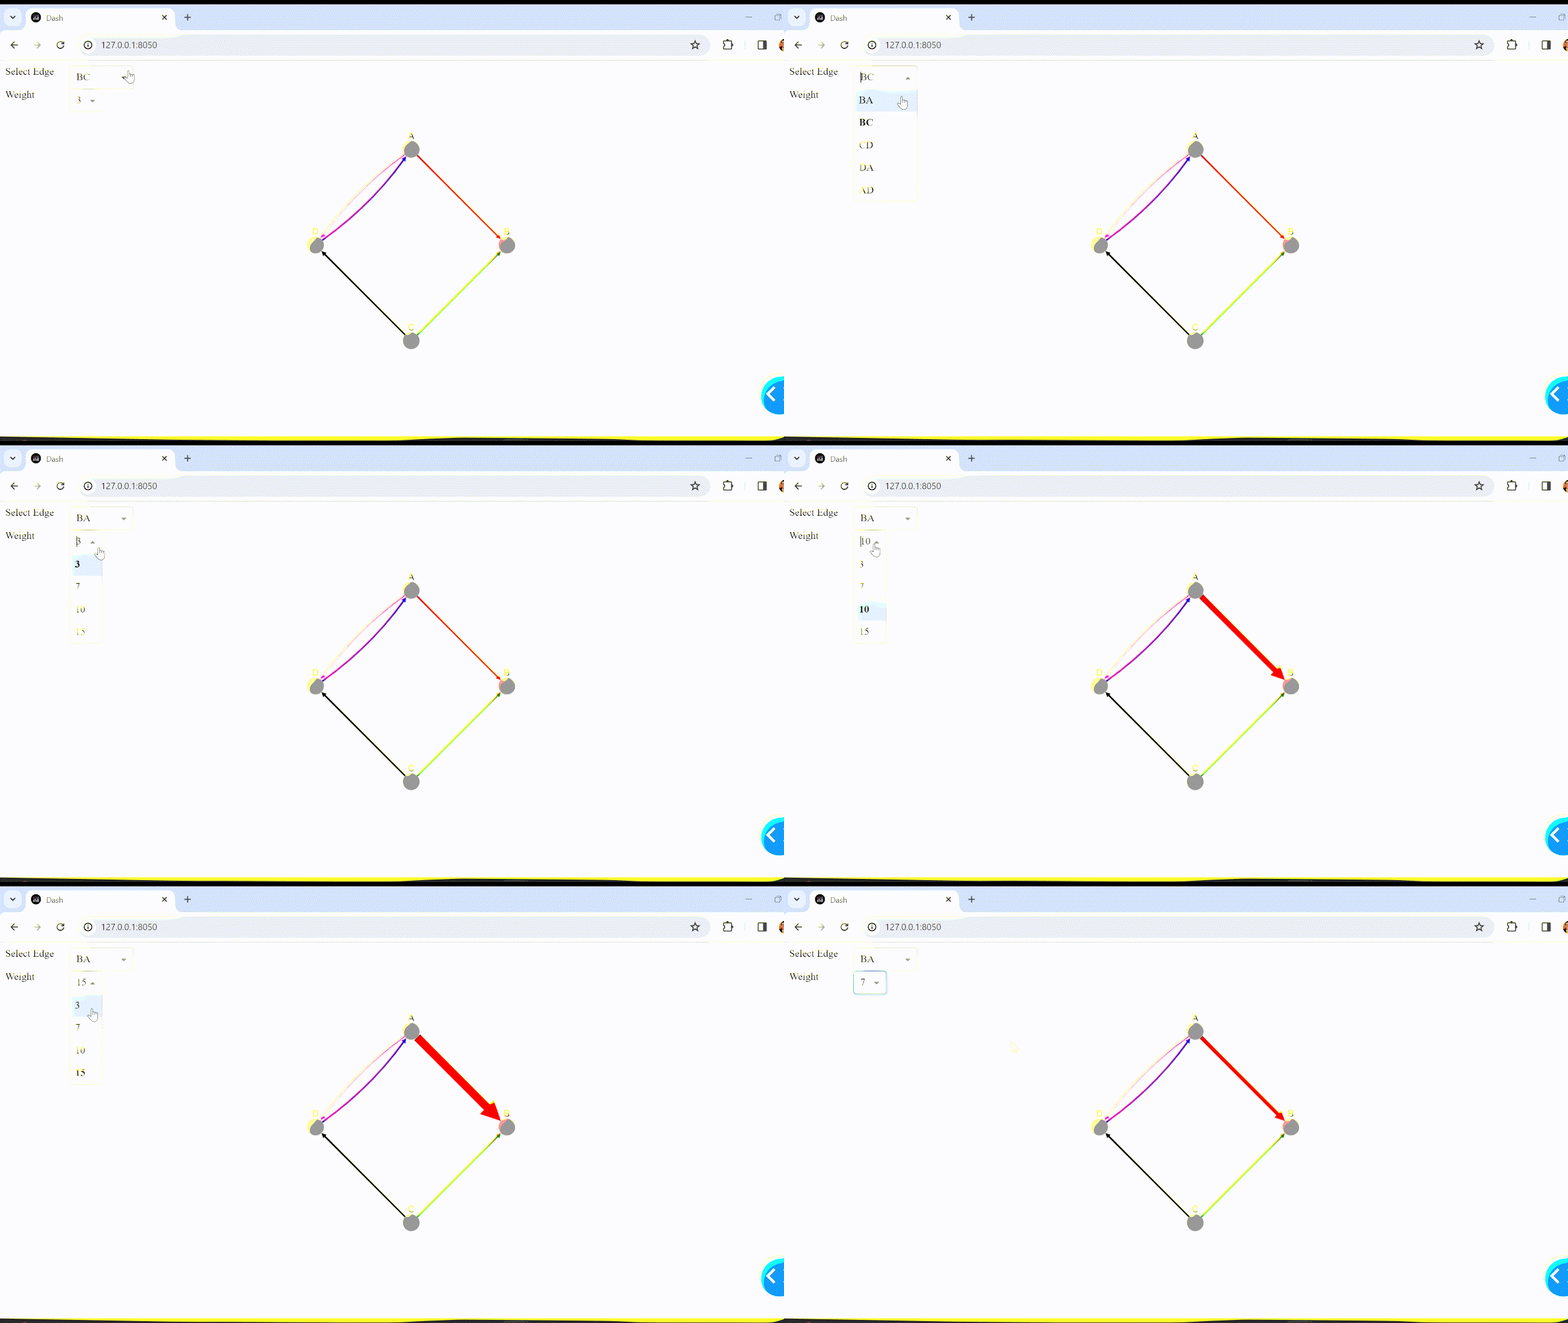
Hi I am very new to plotly. I have a network but I would like to animate the line on one of the edges to grow based on a list of values. I am not sure how to do that.
Below is the code I have:
`from dash import Dash, html
import dash_cytoscape as cyto
app = Dash(name)
directed_edges = [
{‘data’: {‘id’: src+tgt, ‘source’: src, ‘target’: tgt, ‘weight’: 7}}
for src, tgt in [‘BA’, ‘BC’, ‘CD’, ‘DA’, ‘AD’]
]
directed_elements = [{‘data’: {‘id’: id_}} for id_ in ‘ABCD’] + directed_edges
app.layout = html.Div([
cyto.Cytoscape(
id=‘cytoscape-styling-9’,
layout={‘name’: ‘circle’},
style={‘width’: ‘100%’, ‘height’: ‘400px’},
elements=directed_elements,
stylesheet=[
{
‘selector’: ‘node’,
‘style’: {
‘label’: ‘data(id)’
}
},
{
‘selector’: ‘edge’,
‘style’: {
# The default curve style does not work with certain arrows
‘curve-style’: ‘bezier’
}
},
{
‘selector’: ‘#BA’,
‘style’: {
‘source-arrow-color’: ‘red’,
‘source-arrow-shape’: ‘triangle’,
‘line-color’: ‘red’
}
},
{
‘selector’: ‘#DA’,
‘style’: {
‘target-arrow-color’: ‘blue’,
‘target-arrow-shape’: ‘triangle’,
‘line-color’: ‘blue’
}
},
{
‘selector’: ‘#AD’,
‘style’: {
‘target-arrow-color’: ‘magenta’,
‘target-arrow-shape’: ‘triangle’,
‘line-color’: ‘magenta’
}
},
{
‘selector’: ‘#BC’,
‘style’: {
‘source-arrow-color’: ‘green’,
‘source-arrow-shape’: ‘triangle’,
‘line-color’: ‘green’,
}
},
{
‘selector’: ‘#CD’,
‘style’: {
‘target-arrow-color’: ‘black’,
‘target-arrow-shape’: ‘triangle’,
‘line-color’: ‘black’,
‘width’: 15,
}
}
]
)
])
if name == ‘main’:
app.run(debug=True)
~

