Animate Rotating Orthographic Map in Python Plotly?

I’ve been trying to get an orthographic globe to automatically rotate longitudinally, but am struggling severely. I found this topic, but the replies are not very helpful as they don’t explain how to form the frames or where to place them. I tried a few different possibilities based on other threads and example code on plotly, but nothing worked.

I finally tried creating a slider control the globe’s spin longitudinally thinking that I could somehow make the slider “Play” through the longitude slider. The screenshot below is what I currently have.

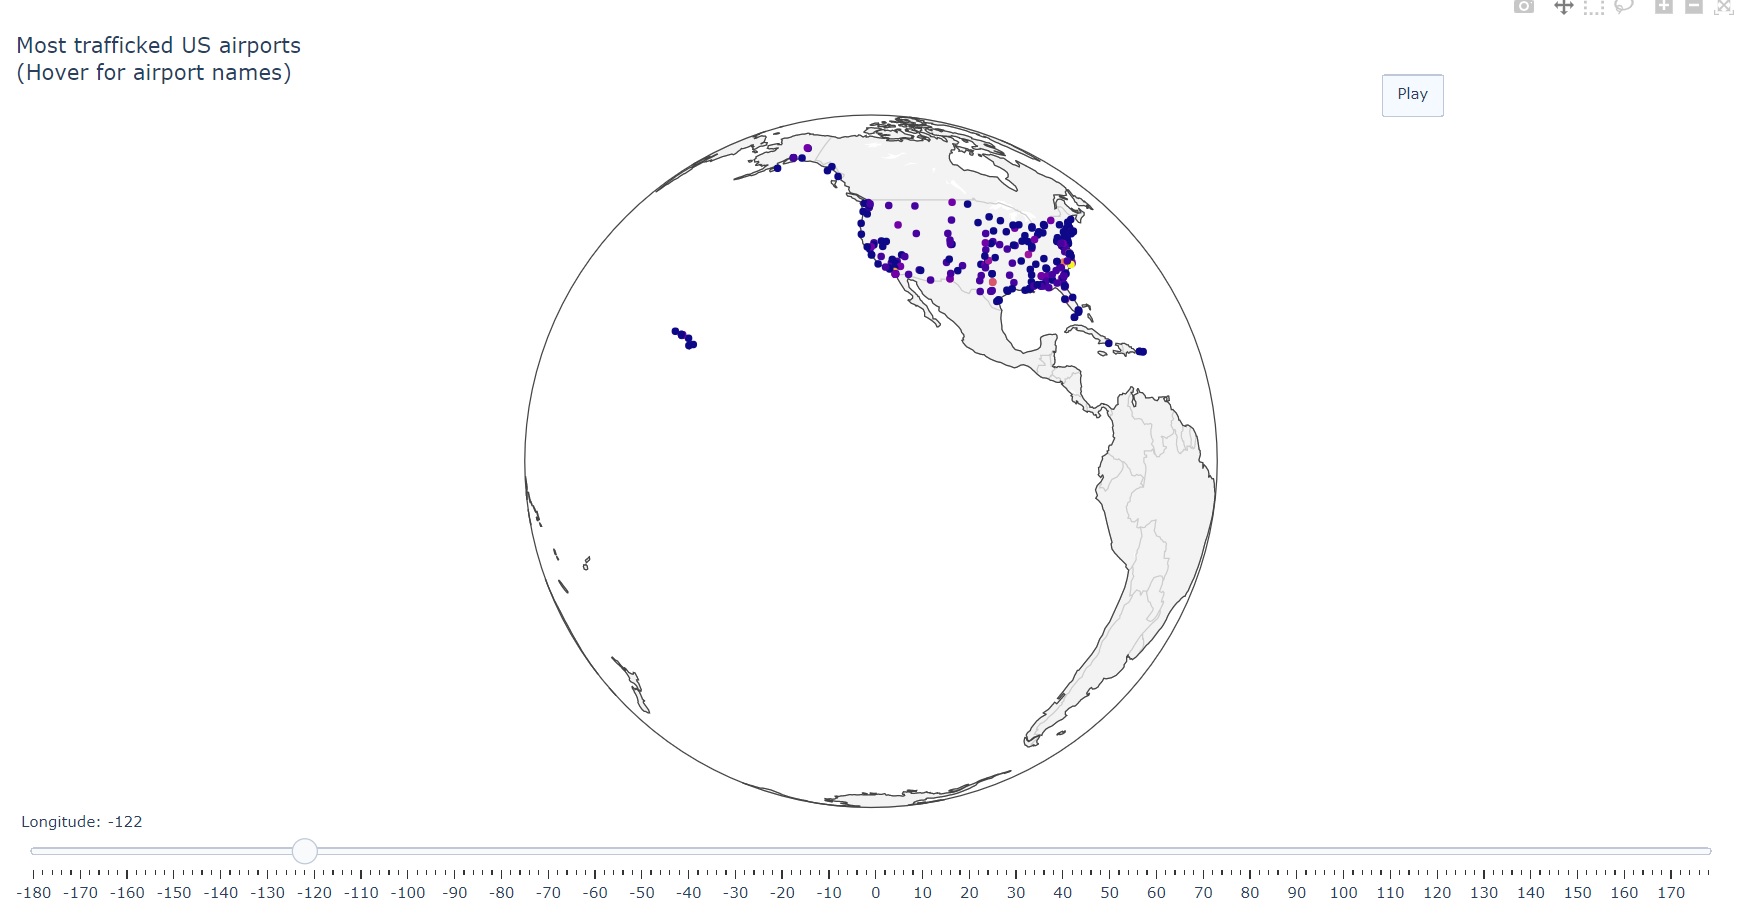
However, I can’t get the play button to actually make the slider move. I’ve tried creating frames, slider steps, and more. I’ve reviewed every plotly resource even tangentially related to this topic and have no succeeded. Clearly I am not understanding something critical in how to do this. Any assistance would be greatly appreciated.

Current code is below:

import plotly.graph_objects as go
from plotly.offline import iplot
import pandas as pd
import numpy as np


if __name__ == "__main__":

    df = pd.read_csv("merge_v2.csv")

    sliders = []
    frames = []

    lon_range = np.arange(-180, 180, 2)

    sliders.append(
        dict(
            active=0,
            currentvalue={"prefix": "Longitude: "},
            pad={"t": 0},
            steps=[{
                'method': 'relayout',
                'label': str(i),
                'args': ['geo.projection.rotation.lon', i]} for i in lon_range]
        )
    )

    # for i in lon_range:
    #     frame = go.Frame(data=[go.Scattergeo(lon=['geo.projection.rotation.lon', i])], name=str(i))
    #     frames.append(frame)

    fig = go.Figure(
        data=go.Scattergeo(
            lon=df['Longitude'],
            lat=df['Latitude'],
            mode='markers',
            marker_color=df['Staff Required']),
        # frames=frames
    )

    fig.update_layout(
        title='Most trafficked US airports<br>(Hover for airport names)',
        geo=go.layout.Geo(
            projection_type='orthographic',
            showland=True,
            showcountries=True,
            landcolor='rgb(243, 243, 243)',
            countrycolor='rgb(204, 204, 204)'
        ),
        sliders=sliders,
        updatemenus=[dict(type='buttons',
                          showactive=True,
                          y=1,
                          x=0.8,
                          xanchor='left',
                          yanchor='bottom',
                          pad=dict(t=45, r=10),
                          buttons=[dict(label='Play',
                                        method='animate',
                                        args=[None, dict(frame=dict(duration=50, redraw=False),
                                                         transition=dict(duration=0),
                                                         fromcurrent=True,
                                                         mode='immediate'
                                                         )]
                                        )
                                   ]
                          )
                     ]
    )
    fig.show()
    print(fig)
1 Like

@vpoonai The basic idea in Plotly animation is to define the initial frame as a data list of Plotly traces.
In your example data contains only one trace: a go.Scattergeo.

The list of frames is a list of dicts with the optional keys : ‘data’, ‘layout’, ‘traces’, ‘name’.

  • ‘data’: is a list of dicts. Each dict contains the updated attributes of the corresponding trace in the fig.data
  • ‘layout’: is a dict of fig.layout attributes that are updated from frame to frame
  • ‘traces’: [0, 1] # gives the list o trace indices included in fig.data, that are updated by the corresponding dict in each frames[k][‘data’]
  • ‘name’: is a string giving the name of the corresponding frame

In our case each frame updates only some layout attributes. Hence it contains a dict with a single key, ‘layout’.

The required rotation is implemented here https://plot.ly/~empet/15245

Well shoot I didn’t know geo_projection_rotation_lon existed. Thanks @empet!! This worked perfectly.

Oddly though, when I add lines connecting some of my coordinates as a separate list to place when defining fig, there’s a significant slowdown in the speed of the globe’s rotation. I assume this is a limitation of either the browser or of plotly? If so, are there any work around’s you’d recommend?

@vpoonai Define lon_range=np.arange(-180, 180, 4), and replace frame duration in updatemenus with 50, 40, 30, i.e. increase the speed of frame display.

1 Like

I am trying to do a similar project and have trouble understanding how that button work

I know it’s been a while, but would you be ok showing me a code that would make the globe turn by default, maybe as if the play button was a “pause” one ?

Hi @Sebvcpnt,

If I understood your question you’d like to rotate the globe without acting the button. It is possible, but I’m sure you don’t like it because it rotates slowly.

Remove updatemenus from layout and display the figure as follows:

from plotly.offline import download_plotlyjs, init_notebook_mode,  iplot, plot
init_notebook_mode(connected=True)
iplot(fig, auto_play=True)  #or plot(fig, filename='rotation.html', auto_play=True)

In this case the frame duration has the default value =500, and there is no possibility to change it because we removed the button where the duration could be set.

Another version is to associate a slider to the figure:

import plotly.graph_objs as go
import numpy as np

data=[go.Scattergeo(
            lat=[45.5017, 51.509865, 52.520008],
            lon=[-73.5673, -0.118092, 13.404954 ],
            mode='markers',
            marker_color='red')]

layout =go.Layout(width=500, height=500,
        title_text='Your title',
        title_x=0.5,
        geo=go.layout.Geo(
            projection_type='orthographic',
            center_lon=-180,
            center_lat=0,
            projection_rotation_lon=-180,
            showland=True,
            showcountries=True,
            landcolor='rgb(243, 243, 243)',
            countrycolor='rgb(204, 204, 204)'
        ))


lon_range = np.arange(-180, 180, 2)

frames = [go.Frame(layout=go.Layout(geo_center_lon=lon,
                                    geo_projection_rotation_lon =lon
                                   ),
                   name =f'fr{k+1}') for k, lon in enumerate(lon_range)]


sliders = [dict(steps = [dict(method= 'animate',
                              args= [[f'fr{k+1}'],                           
                                     dict(mode= 'immediate',
                                          frame= dict(duration=10, redraw= True),
                                          transition=dict(duration= 0))],
                              label=f'fr{k+1}'
                              ) for k in range(len(lon_range))], 
               
                transition= dict(duration= 0 ),
                x=0, # slider starting position  
                y=0,   
               len=1.0) #slider length
           ]


fig = go.Figure(data=data, layout=layout, frames=frames)
fig.update_layout(sliders=sliders)
fig.show()

Note that here I defined a frame in the list frames as an instance of the classgo.Frame, not as a dict, like in the initial code for globe rotation. The low level code using dicts is faster, while that using OOP is just to show you are a skilled pythonista :slight_smile: The result is the same.

1 Like

Thanks a lot for your help, #1 works great. Why isn’t it possible to go ‘under the hood’ to change the frame rate ? It seems to me that shouldn’t be much of an issue ?

Also, it seems this solution makes me loose the ability to update the plot without relaunching it, am I correct ?

I am trying to auto-update locations on the globe that are written continuously on a text file by a bot. The easy way would be to do it on a map but that’s not very pretty :wink: