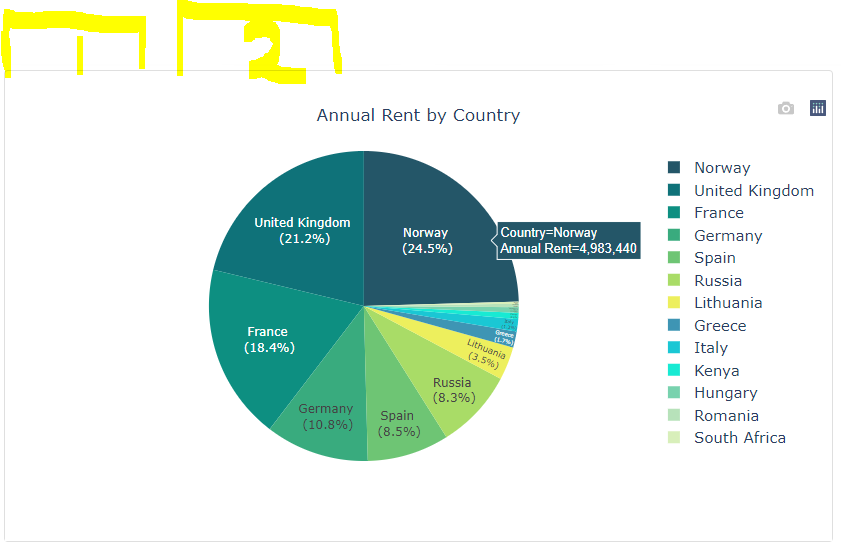
Is there a way to allow users to choose what they want to be displayed on the graph?
Something similar to this:
So the graph initially loads with 1 and then if the user clicks 2 for example, the chart will become Rentable Area by Country rather than Annual Rent by Country.
Can someone please point me to the right direction of how I can achieve that with dash ? I tried using a button but it does not work as in the callback I already have a submit button to generate this graph.
You could do this utilizing callback context
In your callback, the input would be your submit button and the two buttons you’d create and the output would be this pie chart figure., then depending on which button was clicked, you could choose what you want it to do with an if statement.
2 Likes
Could you please help me out with that?
Simplified code below:
dbc.Button('Submit', id='submit_button')

dbc.Col([
         dbc.Card([
             html.Button(className='button btn btn-sm',
                         id='pie1_change',
                         n_clicks=0,
                         children='Rentable Area'),

             dcc.Graph(id='pie_chart1', style={'margin-top': '20px'}, figure=blank_fig())], style={'margin-top': '30px'}),
], width=4)


# Pie Chart - Country with Annual Rent
@callback(
    Output('pie_chart1', 'figure'),
    [Input('submit_button', 'n_clicks')],
    [State('country_checklist', 'value'),
     State('radios_currency', 'value')]
)
def update_pie_chart_1(n_clicks, selected_country, selected_currency):
    if not selected_country and n_clicks is None:
        return dash.no_update
    elif selected_currency == '$':
        df_pie = df[(df['Country'].isin(selected_country))]
        fig = px.pie(df_pie, values='Annual Rent', names='Country', color_discrete_sequence=px.colors.sequential.Aggrnyl)
        return fig

    else:
        df_pie = df[(df['Country'].isin(selected_country))]
        fig = px.pie(df_pie, values='Annual Rent_EUR', names='Country', color_discrete_sequence=px.colors.sequential.Aggrnyl)
        return fig
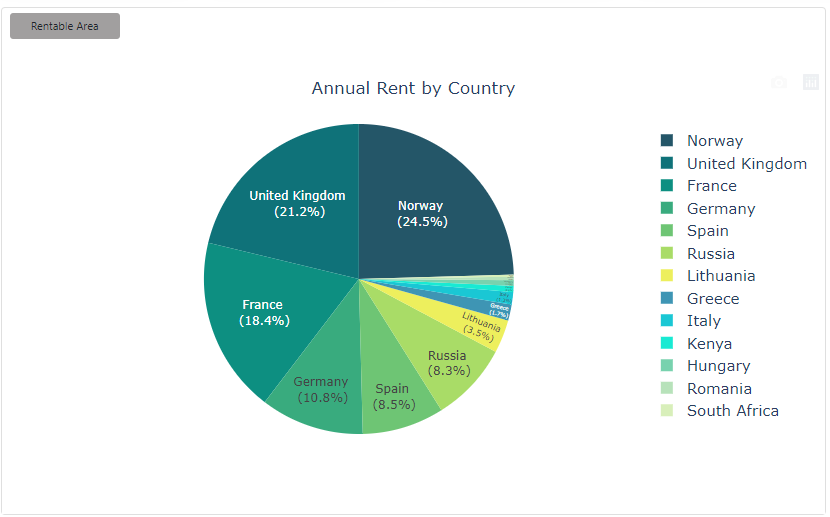
This now generates this output:
With that how can I add the callback context to now when the user clicks ‘Rentable Area’ the chart will update (change highlighted below):
fig = px.pie(df_pie, values='Rentable Area', names='Country', color_discrete_sequence=px.colors.sequential.Aggrnyl)
I’d probably do something like this
dbc.Button('Submit', id='submit_button')

dbc.Col([
         dbc.Card([
             html.Button(className='button btn btn-sm',
                         id='pie1_change',
                         n_clicks=0,
                         children='Rentable Area'),

             dcc.Graph(id='pie_chart1', style={'margin-top': '20px'}, figure=blank_fig())], style={'margin-top': '30px'}),
], width=4)


# Pie Chart - Country with Annual Rent
@callback(
    Output('pie_chart1', 'figure'),
    [Input('submit_button', 'n_clicks'),
     Input('pie1_change', 'n_clicks')],
    [State('country_checklist', 'value'),
     State('radios_currency', 'value')]
)
def update_pie_chart_1(n_clicks, rent_area_btn, selected_country, selected_currency):
    if not selected_country and n_clicks is None:
        return dash.no_update

    ctx = callback_context

    button_id = ctx.triggered[0]['prop_id'].split('.')[0]

    df_pie = df[(df['Country'].isin(selected_country))]

    if button_id == 'pie1_change':
        fig = px.pie(df_pie, values='Rentable Area', names='Country', color_discrete_sequence=px.colors.sequential.Aggrnyl)

    else:

        if selected_currency == '$':
            rent_value = 'Annual Rent'
        else:
            rent_value = 'Annual Rent_EUR'

        fig = px.pie(df_pie, values=rent_value, names='Country', color_discrete_sequence=px.colors.sequential.Aggrnyl)

    return fig
I don’t have your data so i can’t run it but this should in theory work for what you are attempting. CTX will contain whatever the “input context” is be it page load, button, basically whatever causes that callback to fire.