Hello to every one,
I’m struggling into center align a figure inside a dcc.Graph components:
This is what I get:

And this is what I need:
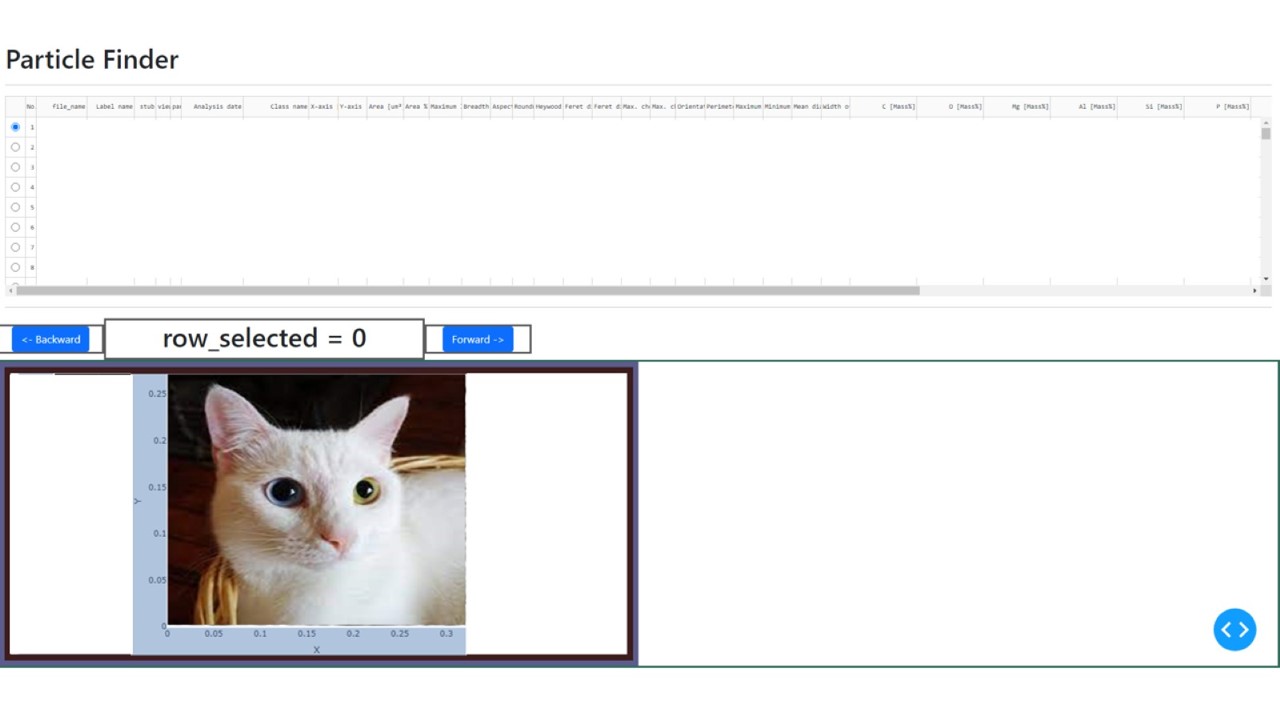
The main point here is that the image I’ve placed inside the graph can change, and its aspect ratio and number of pixels could also change but I would like to have it in the middle of the purple column. Plus I don even know why I have a blank space on the left.
I’ve tried changing the style of the column, row, and graph….I’m new to Dash and I know that something is missing but I cannot find it.
Is there someone that can help me?
this is the code:
the figure:
# Create figure
fig = go.Figure(
    data = go.Scatter(
                        # x=[0, img_width * scale_factor],
                        # y=[0, img_height * scale_factor],
                        # mode="markers",
                        # marker_opacity=0
        ),

    layout = go.Layout(

                        xaxis = dict(title = 'X', showgrid=False, range = [0, img_width] ),
                        yaxis = dict(title = 'Y', showgrid=False, range = [0, img_height]  , scaleanchor="x", scaleratio=1),
                        autosize = True,
                        width= 500,
                        height=500*img_AR,
                        margin=dict(
                        l=0,
                        r=0,
                        b=0,
                        t=0,
                        pad=0),
                        #plot_bgcolor = 'white', #Sets the background color of the plotting area
                        # width=img_width * scale_factor,
                        # height=img_height * scale_factor,
                        #margin={"l": 0, "r": 0, "t": 0, "b": 0},
                        paper_bgcolor="LightSteelBlue",
                        images =  [dict(
                            # https://plotly.com/python/reference/layout/images/#layout-images-items-image-sizing
                            layer = 'below', #Specifies whether images are drawn below or above traces
                            sizex = img_width * scale_factor,#Sets the image container size horizontally.
                            sizey = img_height * scale_factor,#Sets the image container size vertically
                            sizing = "stretch",#Specifies which dimension of the image to constrain.  "fill" | "contain" | "stretch"
                            source = img, #URL or PIL object
                            opacity=1.0,

                            xref="x", #set x parameter to coordinate in x axes
                            yref="y", #set y parameter to coordinate in y axes
                            xanchor = "left", #Sets the anchor for the x position. "left" | "center" | "right"
                            yanchor = "bottom", #Sets the anchor for the y position. "top" | "middle" | "bottom"
                            x=0,
                            y=0,     #img_height * scale_factor,
                           )]  #must be a touple or a list of image dicts
        )
    )
Dash:
app.layout = dbc.Container(
    [
        html.H1("Particle Finder"),
        html.Hr(),
        dbc.Row(table),
        html.Hr(),
        dbc.Row(
            [
             dbc.Col([button_backward], md=1,align="center",style={'textAlign': 'center',"border": "3px #5c5c5c solid"} ),
             dbc.Col(current_selected, md=3, align="center",style={"border": "3px #5c5c5c solid"}),
             dbc.Col([button_forward], md=1, align="center",style={'textAlign': 'center',"border": "3px #5c5c5c solid"}),
             dbc.Col( md=7),
            ],
          # align="center",
          justify = 'end',
        ),
       dbc.Row(
            [
             dbc.Col([dbc.Row(
                             [dcc.Graph(id="fig",figure=fig,
                                         style={
                                            # "width": "100%",
                                            # "height": "800px",
                                            # "display": "inline-block",
                                             "border": "9px #3c1c1c solid",
                                            # "padding-top": "0px",
                                            # "padding-left": "0px",
                                            # "overflow": "hidden",
                                            # "top": "200%",
                                            # "left": "20%",
                                             # "align" : "center",
                                             # "justify" : "center",
                                             # 'horrizontal-align': 'center',
                                            # "margin-top": "-400px"
                                                     }
                                       )
                              ],

                              style = {"justify" : "center","border": "8px #5c5c8c solid"}
                             ),
                     ],
                     md = 6,
                    ),
            ],
            justify = 'left',
            style = {"border": "3px #2c6c5c solid"},
        ),

    ],
    fluid=True,
)