I have the following code,
    def plot_back(self):
        """back half of sphere"""
        u_angle = np.linspace(0, np.pi, 25)
        v_angle = np.linspace(0, np.pi, 25)
        x_dir = np.outer(np.cos(u_angle), np.sin(v_angle))
        y_dir = np.outer(np.sin(u_angle), np.sin(v_angle))
        z_dir = np.outer(np.ones(u_angle.shape[0]), np.cos(v_angle))
        self.plotly_figure.add_surface(z=z_dir, x=x_dir, y=y_dir, opacity=self.sphere_alpha,
                                       colorscale=[[0, self.sphere_color], [1, self.sphere_color]])

        # wireframe
        lines = []
        line_marker = dict(color=self.frame_color, width=2)
        for i, j, k in zip(x_dir[0::5], y_dir[0::5], z_dir[0::5]):
            lines.append(go.Scatter3d(x=i, y=j, z=k, mode='lines', line=line_marker, opacity=self.frame_alpha))
        self.plotly_figure.add_traces(lines)

 def plot_front(self):
        """front half of sphere"""
        u_angle = np.linspace(-np.pi, 0, 25)
        v_angle = np.linspace(0, np.pi, 25)
        x_dir = np.outer(np.cos(u_angle), np.sin(v_angle))
        y_dir = np.outer(np.sin(u_angle), np.sin(v_angle))
        z_dir = np.outer(np.ones(u_angle.shape[0]), np.cos(v_angle))
        self.plotly_figure.add_surface(z=z_dir, x=x_dir, y=y_dir, opacity=self.sphere_alpha,
                                       colorscale=[[0, self.sphere_color], [1, self.sphere_color]])
        # wireframe
        lines = []
        line_marker = dict(color=self.frame_color, width=2)
        for i, j, k in zip(x_dir[0::5], y_dir[0::5], z_dir[0::5]):
            lines.append(go.Scatter3d(x=i, y=j, z=k, mode='lines', line=line_marker, opacity=self.frame_alpha))
which produces a sphere as show below:
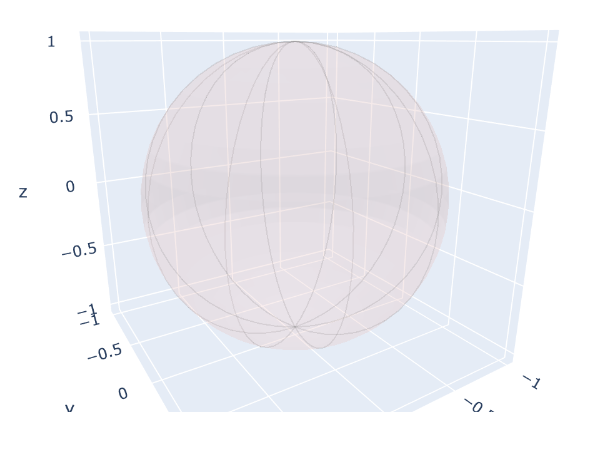
I want to add circles around the sphere so it will end up looking something like this:

but i can’t seem to get this right and i;ve been trying for hours now.
HELP!
thanks