Hi,
I am not sure if this is possible, so here’s the question.
What I want to accomplish:
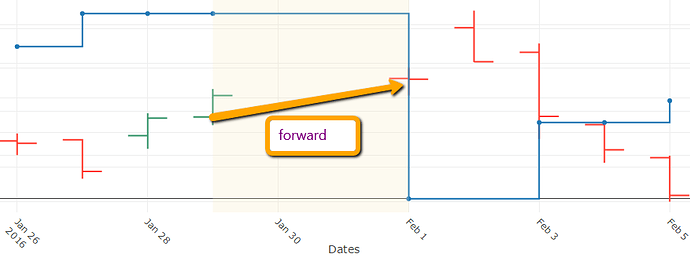
I already have OHLC and Scatter line with markers (HV)
I want to add the orange arrow with text as shown in the screenshot. I know the x0,y0 and x1,y1 coordinates of the orange line that I want to display as an arrow in Plotly javascript.
What is the proper way to accomplish that (if possible)?
- Adding another trace to the plot with a custom marker at the end (arrowhead). How?
- Adding annotation and play with the orientation
- Adding shape line / path. How do I add the arrowhead marker at x1,y1?
Thanks in advance,
Dimitri
