Hi there,
I’m working on a dashboard at work and here’s what its looking like:
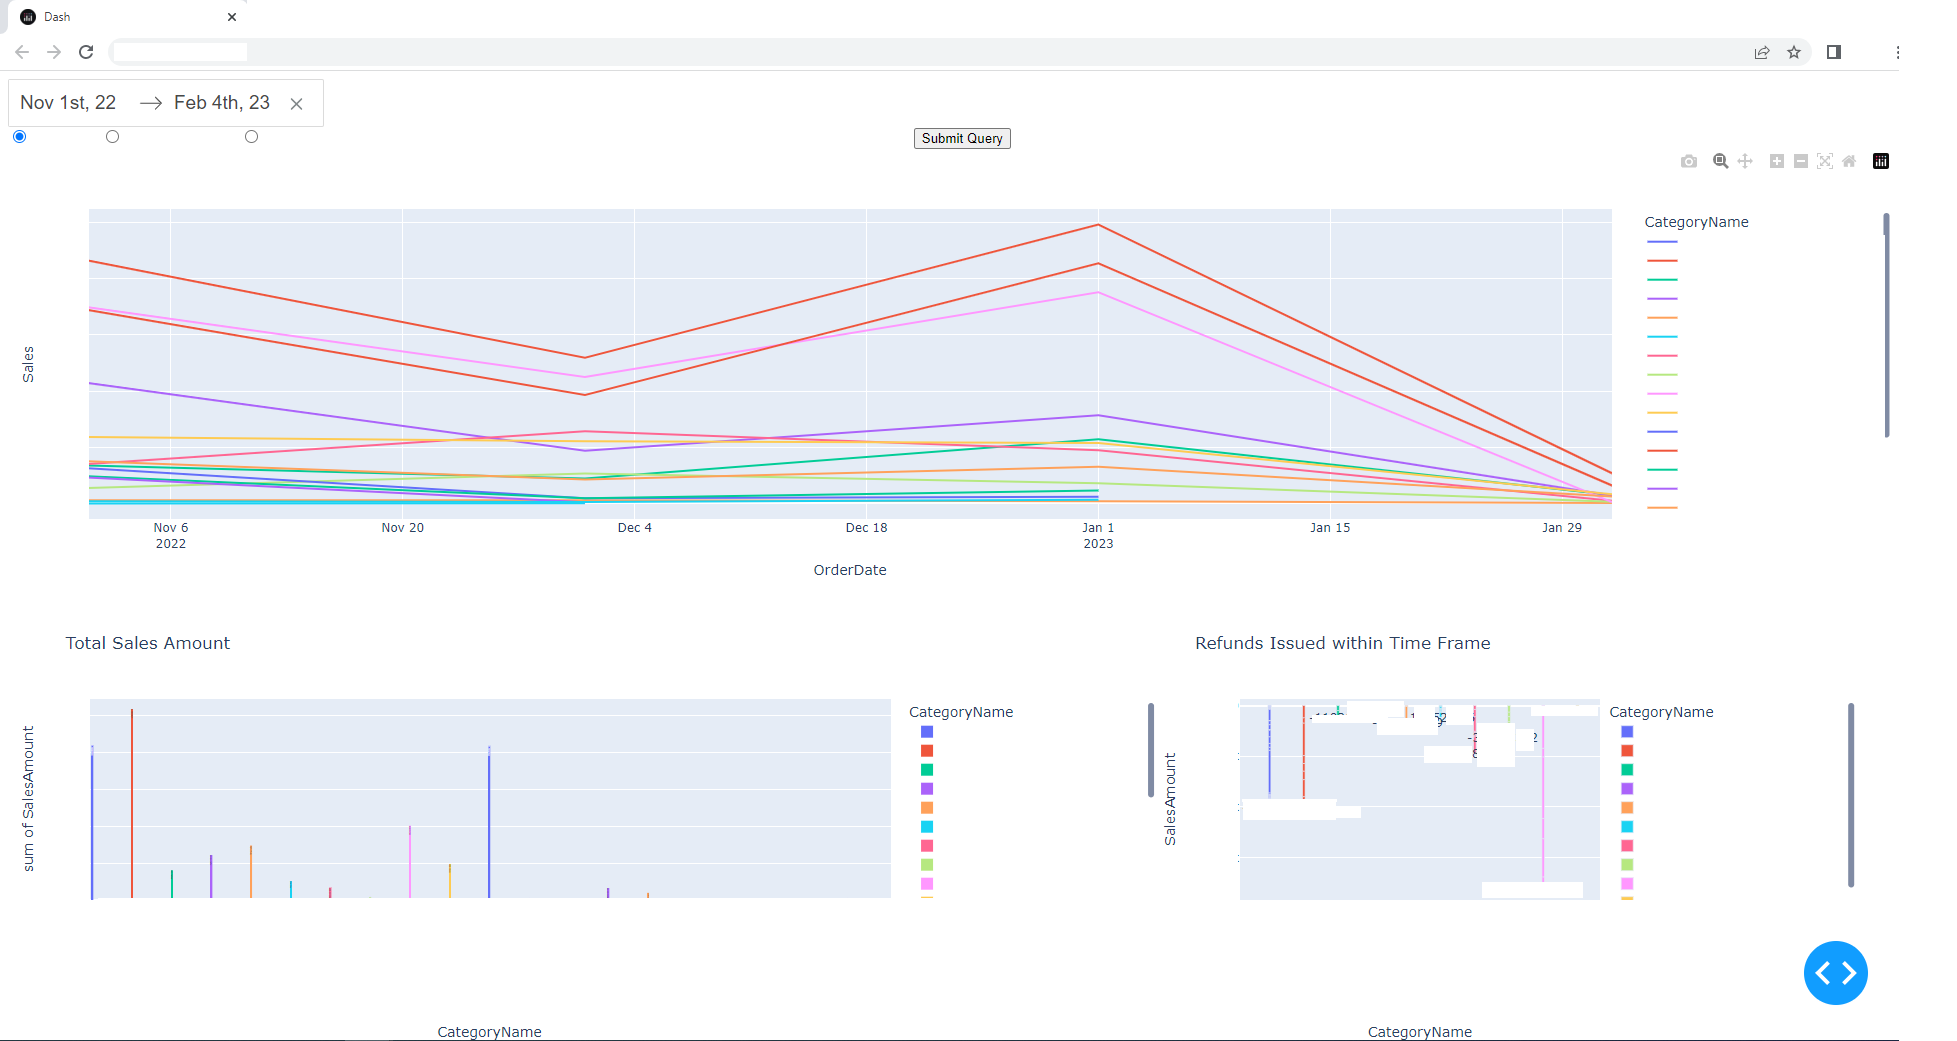
I’m looking to incorporate a dropdown box once the tree graphs are displayed with the date range and one of the radio buttons pressed.
So, my code is below. I attempted to initialize a dropdown but I’m lost with how to incorporate it after my graphs are made.
I want it to pop up after the graphs are made so you can select a single customer OR view all like how it is without a drop down box currently.
Any help and guidance would be appreciated
#Initalizing the app
app = JupyterDash(__name__)

#Define the layout of the app
app.layout = html.Div([

    #Groups widgets together
    html.Div([
        # Date Picker Widget
        dcc.DatePickerRange(
            id='my-date-picker-range',
            calendar_orientation = 'horizontal',
            first_day_of_week=0, ##Sunday
            clearable=True,
            display_format= 'MMM Do, YY',
            month_format= 'MMMM, YYYY',
            updatemode='singledate',
            style={'width':'20vw'}
        ),

       **I attempted a Dropdown menu to select the customer**
# dcc.Dropdown(
        #     id='CustomerDropdown',
        #     options=sorted([{'label': customer, 'value': customer} for customer in df_within_range['Customer'].unique()], key=lambda x: x["label"]),
        #     value=df_within_range['Customer'].iloc[0],
        #     clearable = True
        # ),

        # Radio button widget
        dcc.RadioItems(
            id='date-type-radio',
            options=[
                {'label':'Date 1', 'value': 'date1'},
                {'label':'Date 2', 'value':'date2'},
                {'label':'Date 3', 'value':'date3'}],
            value='Order Date',
            inline=True
        ),
    ], style={'width': '48%', 'display': 'inline-block'}),

    # Initiate Button
    html.Button('Submit Query', id='button-example-1'),

    # Display first row of dataframe

    # Scatter Graph
    dcc.Graph(figure={}, id='line-graph'),

    # Histogram
    dcc.Graph(figure={}, id='histogram-graph', style={'display':'inline-block', 'width': '60vw'}),

    # Bar Graph
    dcc.Graph(figure={}, id='bar-graph', style={'display':'inline-block'})

])

## L I N E
@app.callback(
    Output(component_id='line-graph', component_property='figure'),
    # Input(component_id='CustomerDropdown', component_property='value'),
    Input(component_id='date-type-radio', component_property='value'),
    Input(component_id='my-date-picker-range', component_property='start_date'),
    Input(component_id='my-date-picker-range', component_property='end_date'),
    Input(component_id='button-example-1', component_property='n_clicks')
)

def update_line(date_radio, start_date, end_date, buttonpress):

    if buttonpress:
        new_df = selecting_order(start_date, end_date, date_radio)

    # subsubset = df_within_range.loc[(df_within_range.Customer == cust_chosen)] **##drop down filter **

        fig = px.line(data_frame=(new_df
                                  .groupby([pd.Grouper(key = date_radio, freq = "MS"), 'CategoryName'], as_index=True, observed=True, dropna = False)
                                  .agg(Sales = pd.NamedAgg('SalesAmount', 'sum'))
                                  .reset_index()),
                      x = date_radio,
                      y = 'Sales',
                      color = 'CategoryName',
                      # title = 'All Purchases by '+ cust_chosen +' between ' + date1 +' and ' + date2
                     )


        return fig

    raise dash.exceptions.PreventUpdate

## H I S T O G R AM
@app.callback(
    Output(component_id='histogram-graph', component_property='figure'),
    Input(component_id='date-type-radio', component_property='value'),
    Input(component_id='my-date-picker-range', component_property='start_date'),
    Input(component_id='my-date-picker-range', component_property='end_date'),
    Input(component_id='button-example-1', component_property='n_clicks'),
    #Input(component_id='line-graph', component_property='figure')
 )


def update_histogram_graph(date_radio, start_date, end_date, buttonpress):


    if buttonpress:
        print('The button, its been pressed.')
        new_df = selecting_order(start_date, end_date, date_radio)
        new_df_2=(new_df[new_df['SalesAmount']>0])

    # subsubset = df_within_range.loc[(df_within_range.Customer == cust_chosen)] **##drop down filter**


        fig = px.histogram(new_df_2,
                          x= 'CategoryName',
                          y= 'SalesAmount',
                          color = 'CategoryName',
                          barmode = 'group',
                          title = 'Total Sales Amount',
                          text_auto = True
                          )


        return fig

    raise dash.exceptions.PreventUpdate


# ## B A R  G R A P H
@app.callback(
    Output(component_id='bar-graph', component_property='figure'),
    Input(component_id='date-type-radio', component_property='value'),
    Input(component_id='my-date-picker-range', component_property='start_date'),
    Input(component_id='my-date-picker-range', component_property='end_date'),
    Input(component_id='button-example-1', component_property='n_clicks')
 )

def update_bar_graph(date_radio, start_date, end_date, buttonpress):

        if buttonpress:
            print('The button, its been pressed.')

            new_df= selecting_order(start_date, end_date, date_radio)
            new_df_2=(new_df[new_df['SalesAmount']<0])

            fig = px.bar(new_df_2, x='CategoryName', y = 'SalesAmount', color='CategoryName', barmode = 'group', title = 'Refunds Issued within Time Frame')

            if (new_df_2.empty):
                 return fig.add_annotation( text="No Refunds", showarrow = False, font=dict(size = 30))

            fig.update_layout(annotations=[
                {"x": x, "y": total, "text": round(total,3), "showarrow": False}
                for x, total in new_df_2.groupby("CategoryName", as_index=False).agg({"SalesAmount": "sum"}).values])

            return fig

        raise dash.exceptions.PreventUpdate

# Run the app
if __name__ == '__main__':
    app.run_server(debug=True)