Add arbitrary text to a figure

HI,
I am showing two rows of gauges… and I just want to label each row…
Can I just add some text to the figure some way? And position it beside the row?
I look at the info on annotations and that doesn’t seem to fit in what I’m doing…

fig = go.Figure()

fig.add_trace(go.Indicator(
    mode = "gauge+number",
    value = 8.46,
    domain = {'x': [0.1, 0.35], 'y': [0.5, 0.75]},
    gauge = {
        'axis': {'range': [None, 10]},
        'bar': {'color': "gold"},
    },
    title = {'text': "At Home"}),           
    )


fig.add_trace(go.Indicator(
    mode = "gauge+number",
    value = 8.56,
    domain = {'x': [0.4, 0.65], 'y': [0.5, 0.75]},
    gauge = {
        'axis': {'range': [None, 10]},
        'bar': {'color': "gold"},
    },
    title = {'text': "At Work"}),           
    )

fig.add_trace(go.Indicator(
    mode = "gauge+number",
    value =9.2,
    domain = {'x': [0.7, 1], 'y': [0.5, 0.75]},
    gauge = {
        'axis': {'range': [None, 10]},
        'bar': {'color': "gold"},
    },
    title = {'text': "Public Places"}),
              
             )
fig.add_trace(go.Indicator(
    mode = "gauge+number",
    value = 9.2,
    domain = {'x': [0.1, 0.35], 'y': [0, 0.25]},
    gauge = {
        'axis': {'range': [None, 10]},
        'bar': {'color': "gold"},
    },
    title = {'text': "At Home"},
    ),
 )
fig.add_trace(go.Indicator(
        mode = "gauge+number",
        value = 9.2,
        domain = {'x': [0.4, 0.65], 'y': [0, 0.25]},
        gauge = {
            'axis': {'range': [None, 10]},
            'bar': {'color': "gold"},
        },
        title = {'text': "At Work"}
        ),
    )
fig.add_trace(go.Indicator(
    mode = "gauge+number",
    value = 8.67,
    domain = {'x': [0.7, 1], 'y': [0, 0.25]},
    gauge = {
        'axis': {'range': [None, 10]},
        'bar': {'color': "gold"},
    },
    title = {'text': "Public Places"}),
              
             )

fig.show()

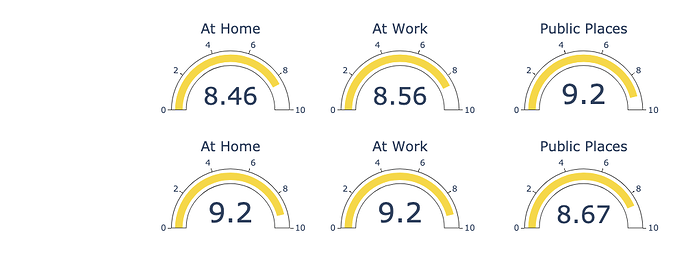
When this runs I get a nice pic like this:

And I’d just like to put some text in the space to the left there… to differentiate the rows…
Just two simple labels… “row 1” and “row 2” for example…

But for the life of me can’t figure out how…

Thanks
I figured out a sort of a solution by adding to the layout … so in the code above … the first line to create the ‘fig’ changes to:

fig = go.Figure(
             layout=go.Layout(
                    annotations=[
                        go.layout.Annotation(
                            text='<B>SELF:</B>',
                            align='right',
                            showarrow=False,
                            xref='paper',
                            yref='paper',
                            x=0,
                            y=0.6,
                        ),
                        go.layout.Annotation(
                            text='<B>OTHERS:</B>',
                            align='right',
                            showarrow=False,
                            xref='paper',
                            yref='paper',
                            x=0,
                            y=0.1,
                        )
                    ]

            )
        )

So now I have…

image

But its a little less than I was hoping for…
If there is a better way I’d love to hear about it…

And, if I can be as bold as to ask one more thing…

If I try to add a dividing line between the rows:

fig.update_layout(shapes=[
    dict(
      type= 'line',
      yref= 'paper', y0= 0.4, y1= 0.4,
      xref= 'x', x0= 0, x1= 1
    )
])

I suddenly get this background and axes added ???

Why? How do I prevent that??
Thanks

Sigh… easy… just set all the refs to paper… ohhkk…

fig.update_layout(shapes=[
    dict(
      type= 'line',
      yref= 'paper', y0= 0.4, y1= 0.4,
      xref= 'paper', x0= 0, x1= 1
    )
])