Hi,
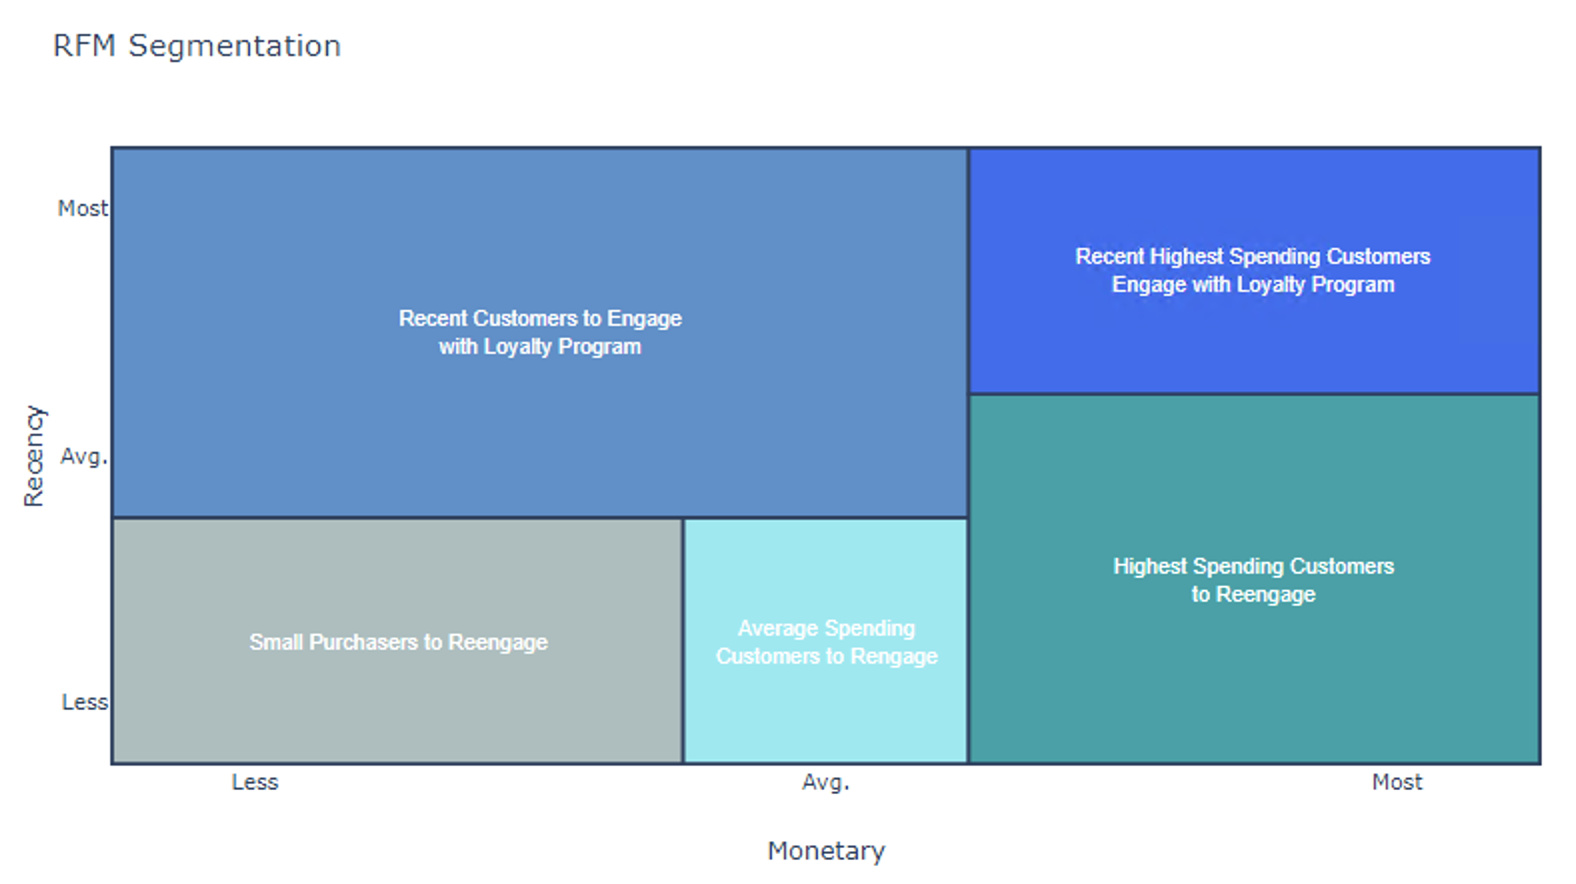
I’m not sure how long your treemap functionality has been around but I made some of my own manually with code like this:
# Make plot
    fig = go.Figure()
    shapes = []

    for r, name, color in zip(rects_dict[rfm_combo], names_dict[rfm_combo], colors_dict[rfm_combo]):
        shapes.append(
            dict(
                type = 'rect',
                x0 = r['x'] * width / 5,
                y0 = r['y'] * height / 5,
                x1 = r['x'] * width / 5 + r['dx'] * width / 5,
                y1 = r['y'] * height / 5 + r['dy'] * height / 5,
                line = dict( width = 2 ),
                fillcolor = color
            )
        )

    fig.layout.update(shapes=shapes)
It looks pretty good, but as of now I have to decide the height and width beforehand to scale it.
Of course, one of the joys of plotly is that is resizes dynamically – is there a way to get the width and height as it is being rendered and use that to manually scale it?
Thanks for your help!