Having used
swap_surface = dict(type=‘surface’,x=x,y=y,z=z)
treas_surface = dict(type=‘surface’,x=x,y=y,z=z)
figz = tools.make_subplots(rows=1,cols=2,specs = [[{‘is_3d’:True},{‘is_3d’:True}]])
figz.append_trace(swap_surface,1,1)
figz.append_trace(treas_surface,1,2)
iplot(figz)
I produced the following side-by-side charts:
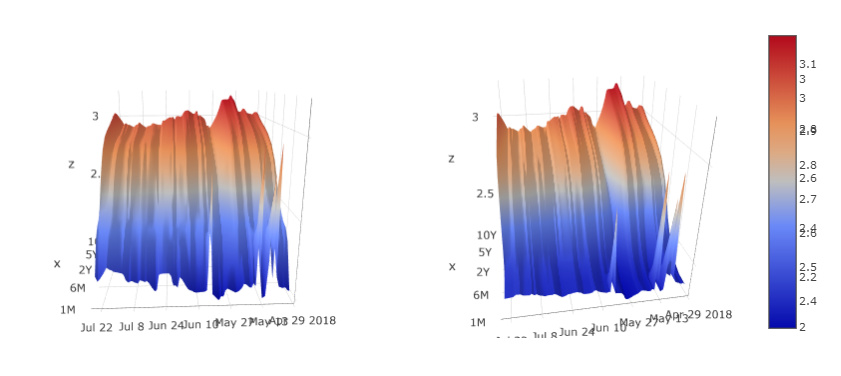
The goal was to have a single color scale shared by both charts, and combined into one legend. Instead I have 2 legends being superimposed on top of each other, rendering them useless.
What’s the fix to have a single consolidated colorscale and a single legend?
Thank you!