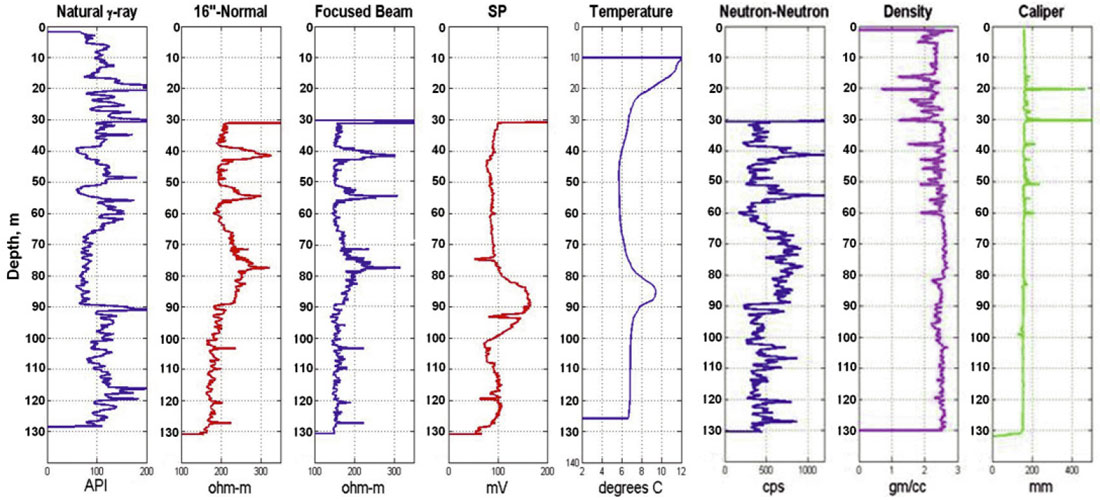
Is it possible to do 2D horizontal histograms in plotly where the 0 origin is at the top left, expanding down? these are quite common in geosciences where depth is depicted on the y axis like:
autorange: ‘reversed’
Related topics
| Topic | Replies | Views | Activity | |
|---|---|---|---|---|
| Can you use plotly to generate the horizontal coordinate shown below? | 0 | 227 | January 5, 2023 | |
| How to use histfunc in the vertical histogram of a histogram2dcontour | 1 | 561 | June 6, 2021 | |
| Plotly graph_object Histogram | 0 | 445 | March 8, 2022 | |
| Name a histogram with two different values to axis-x | 0 | 554 | November 18, 2019 | |
| Make plotly graph vertical | 1 | 585 | December 21, 2020 |