Hi,
I have created a simple app to live stream stock price changes.
import pandas as pd
from dash.dependencies import Input, Output
import dash_bootstrap_components as dbc
from dash import Dash, dcc, html, Input, Output, State, dash_table, Patch, no_update
from yahooquery import Ticker
app = Dash(__name__)
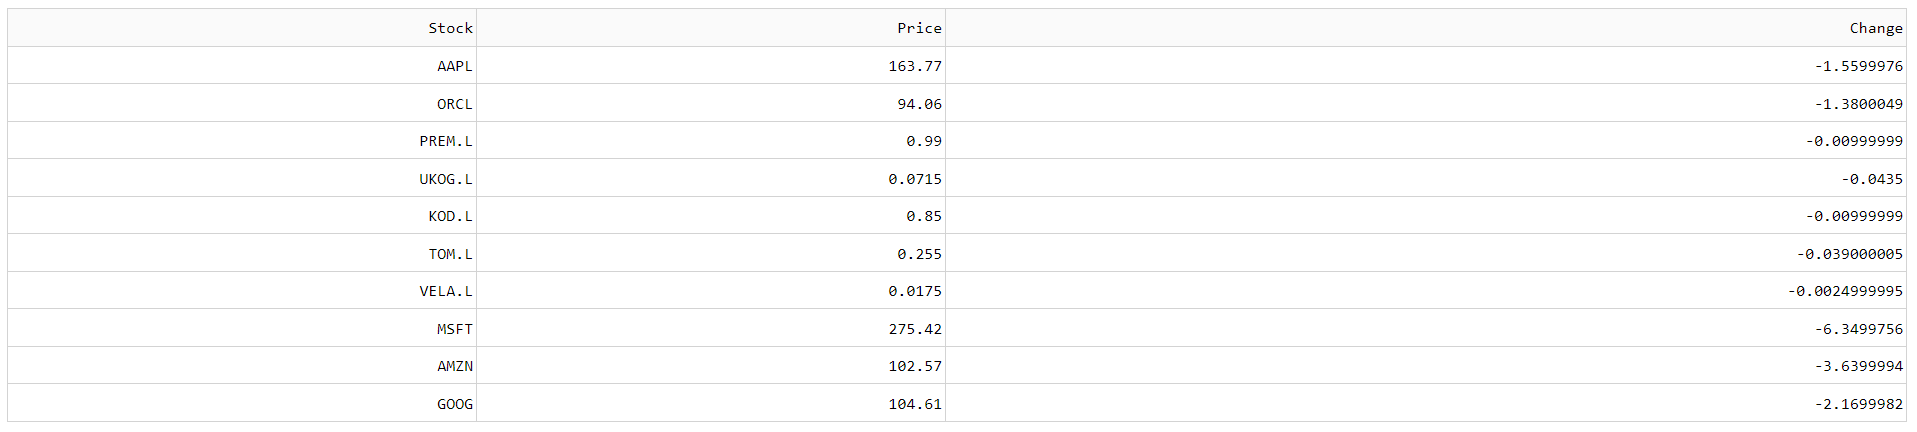
ticker_list = ['AAPL', 'ORCL', 'PREM.L', 'UKOG.L', 'KOD.L', 'TOM.L', 'VELA.L', 'MSFT', 'AMZN', 'GOOG']
def get_data():
all_symbols = " ".join(ticker_list)
myInfo = Ticker(all_symbols)
myDict = myInfo.price
changes = []
for ticker in ticker_list:
#ticker = str(ticker)
price = myDict[ticker]['regularMarketPrice']
change = myDict[ticker]['regularMarketChange']
#mcap = myDict[ticker]['marketCap']
#print(ticker,change, price)
result = change,price
changes.append(result)
df = pd.DataFrame(changes, columns=['Price','Change'])
return df.to_dict('records')
df = pd.DataFrame(ticker_list,columns=['Stock'])
tblcols=[{'name': 'Stock', 'id': 'Stock'},
{'name': 'Price', 'id': 'Price'},
{'name': 'Change', 'id': 'Change'}]
app.layout = dbc.Container([
html.Div(
[
dbc.Row(
dbc.Col(
[
dash_table.DataTable(
data=df.to_dict("records"),
columns=tblcols,
id="df-table",
),
dcc.Interval('update', interval = 5000, n_intervals = 0)
]
),
)
],
className="dbc",
),
],fluid=True)
@app.callback(
Output('df-table', 'data'),
Input('update', 'n_intervals'),
prevent_initial_call=True,
)
def add_data_to_fig(n):
patched_table = Patch()
patched_table[:,[1,2]].update(get_data())
return patched_table
if __name__ == '__main__':
app.run_server(debug=True, host= '192.168.0.13')
I tried to use iloc to update column “Price” and “Change” ![]()
However it returned error AttributeError: ‘list’ object has no attribute ‘update’ .
Whenever i try to patched_table.prepend(get_data()) it append new rows to the end of the table but to the right columns.
What shall i do to update only columns “Price” and “Change”.
Thanks in advance.