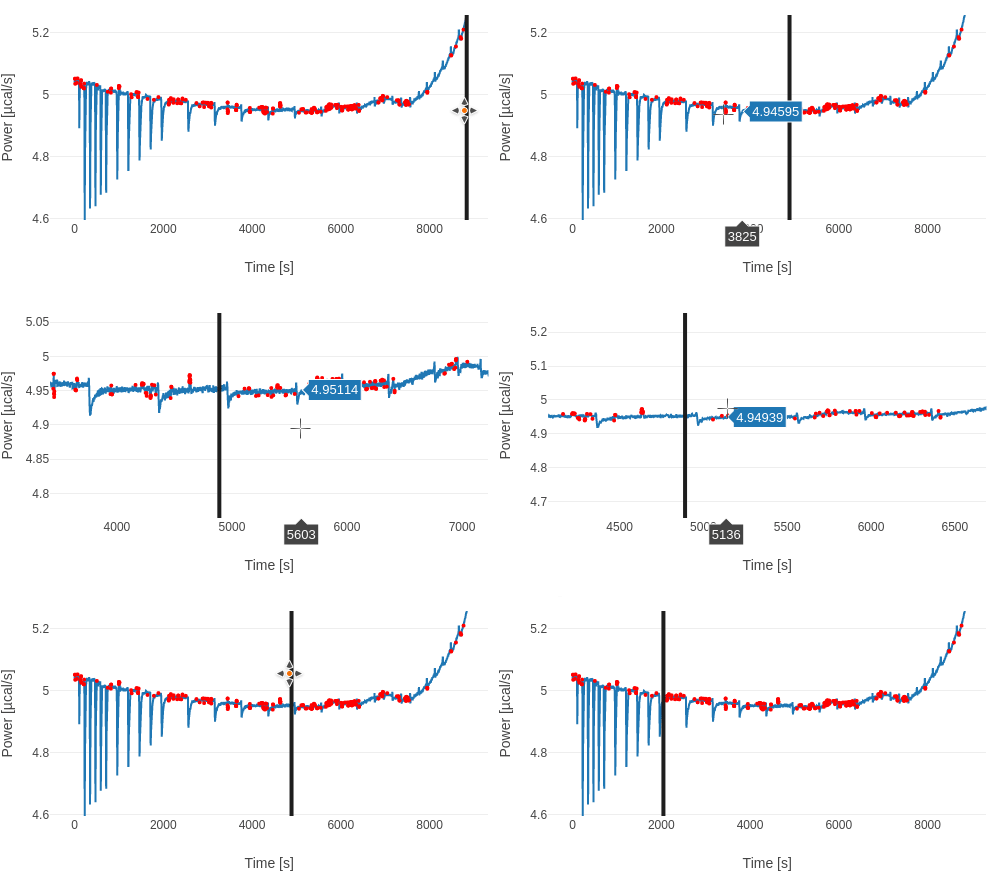
After some work, I figured it out to make something similar…

Basically:
-A line shape in my chart
-Disable the dragging events for the boundaries of the shape (in CSS). This only allows dragging the bar vertically/horizontally.
-Create the vertical line greater than required (use a custom multiplier -10/10 based on min/max values of data). If you adjust it nicely, your vertical bar never gets out of the chart.
-yaxis range set to min/max values of data. This way, chart is focused on the data, not on the bigger vertical shape we’ve created.
-Attached a function in the ‘plotly_afterplot’ to: retrieve the new line position, and redraw it again to adjust its vertical values to its original values (this is just in case, the user moved the shape vertically)