# Interaction with ipywidget slider is slow (performance is much lower than a matplotlib equivalent)
**URL:** https://community.plotly.com/t/interaction-with-ipywidget-slider-is-slow-performance-is-much-lower-than-a-matplotlib-equivalent/31957
**Category:** 📊 Plotly Python
**Created:** [November 27, 2019, 7:15pm UTC](https://community.plotly.com/t/interaction-with-ipywidget-slider-is-slow-performance-is-much-lower-than-a-matplotlib-equivalent/31957 "2019-11-27T19:15:01Z")
**Posts on this page:** 5
**Page:** 1
### Author:  [@nvaytet](https://community.plotly.com/u/nvaytet)
#### Post date: [November 27, 2019, 7:15pm UTC](https://community.plotly.com/t/interaction-with-ipywidget-slider-is-slow-performance-is-much-lower-than-a-matplotlib-equivalent/31957/1 "2019-11-27T19:15:02Z")
I am using an `ipywidgets` slider to slice a 2D `numpy` array along the y dimension in a Jupyter notebook.
The interaction with the slider seems very sluggish/laggy when using `plotly`. An equivalent `matplotlib` solution is much faster/reactive. I post a copy of my code below (the poor performance is more visible when 2 traces are plotted).
Am I doing anything wrong?
If not, what could be the reason?
I am suspecting some of the performance loss could come from copies of the data being made between the `numpy` arrays and `plotly`'s Javascript backend. Maybe `plotly` does a lot of extra work behind the scenes that also slow things down? (i’ve tried to keep the yrange constant to avoid constant auto layout calculation but this does not seem to help).
Thanks for any help!
```auto
import plotly.graph_objects as go
import ipywidgets as widgets
import numpy as np
import IPython.display as disp
import matplotlib.pyplot as plt
%matplotlib notebook
N = 1000
M = 500
xx = np.linspace(0.0, 12.0, N)
yy = np.linspace(0.0, 6.0, N)
x, y = np.meshgrid(xx, yy)
a = [np.sin(np.sqrt(x **2 + y** 2))]
a.append(np.random.normal(a[0] * 0.1, 0.05))
fig1, ax = plt.subplots(1, 1)
ax.plot(xx, a[0][:, 0])
ax.plot(xx, a[1][:, 0])
ax.set_ylim([-1, 1])
sl = widgets.IntSlider(
value=0,
min=0,
max=M,
step=1,
continuous_update=True,
readout=True)
def update_y(change):
for i, line in enumerate(ax.lines):
line.set_ydata(a[i][:, change["new"]])
sl.observe(update_y, names="value")
disp.display(sl)
```
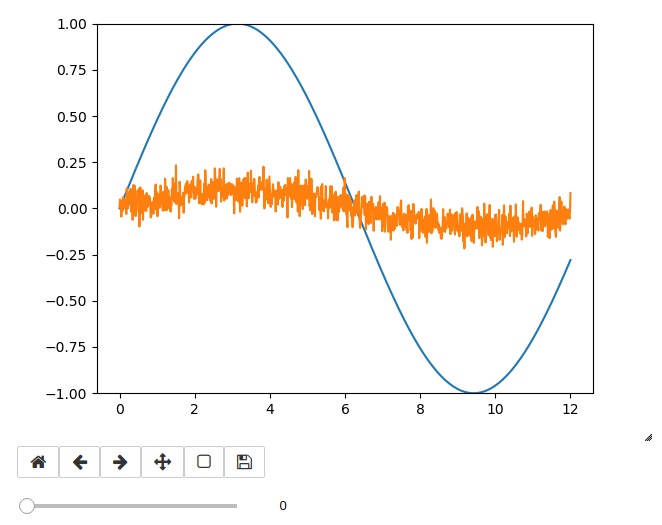
```auto
fig2 = go.FigureWidget(layout={"yaxis": {"range": [-1, 1]}})
fig2.add_trace(go.Scatter(x=xx, y=a[0][:, 0]))
fig2.add_trace(go.Scatter(x=xx, y=a[1][:, 0]))
sl2 = widgets.IntSlider(
value=0,
min=0,
max=M,
step=1,
continuous_update=True,
readout=True)
def update_y2(change):
for i in range(len(fig2.data)):
fig2.data[i].y = a[i][:, change["new"]]
sl2.observe(update_y2, names="value")
disp.display(widgets.VBox((fig2, sl2)))
```
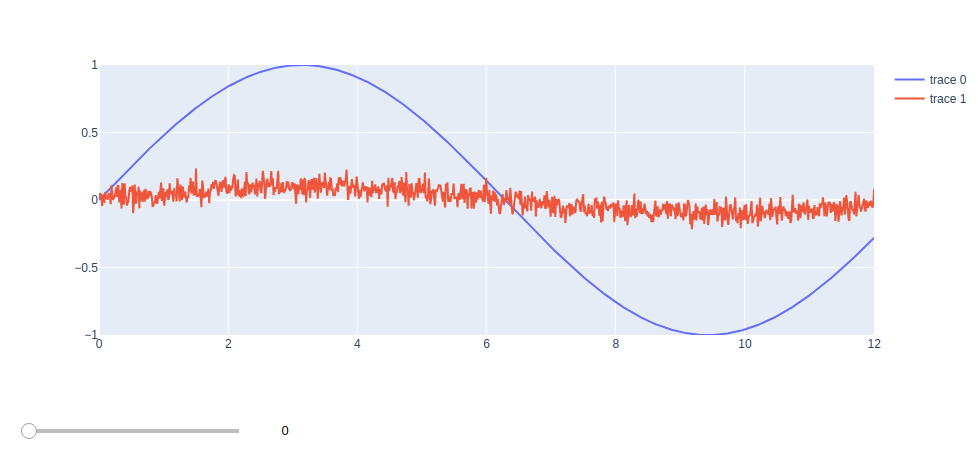
---
### Author:  [@Emmanuelle](https://community.plotly.com/u/Emmanuelle)
#### Post date: [November 28, 2019, 6:55pm UTC](https://community.plotly.com/t/interaction-with-ipywidget-slider-is-slow-performance-is-much-lower-than-a-matplotlib-equivalent/31957/2 "2019-11-28T18:55:15Z")
Hi @nvaytet you can probably gain a factor of two by using `fig.batch_update()` as in [https://plot.ly/python/click-events/](https://plot.ly/python/click-events/). Without it update for each trace is being sent to the front-end individually.
---
### Author:  [@nvaytet](https://community.plotly.com/u/nvaytet)
#### Post date: [November 29, 2019, 11:25am UTC](https://community.plotly.com/t/interaction-with-ipywidget-slider-is-slow-performance-is-much-lower-than-a-matplotlib-equivalent/31957/3 "2019-11-29T11:25:46Z")
Hi @Emmanuelle, thanks for the tip. I did not know about `batch_update`.
This probably answers my other question i posted recently: [Is it possible to update multiple traces with different value arrays in one go?](https://community.plotly.com/t/is-it-possible-to-update-multiple-traces-with-different-value-arrays-in-one-go/31597)
thanks!
---
### Author:  [@Emmanuelle](https://community.plotly.com/u/Emmanuelle)
#### Post date: [November 30, 2019, 3:51am UTC](https://community.plotly.com/t/interaction-with-ipywidget-slider-is-slow-performance-is-much-lower-than-a-matplotlib-equivalent/31957/4 "2019-11-30T03:51:58Z")
Yes, indeed :-). Maybe we need to add more examples with `batch_update` to the documentation!
---
### Author:  [@nvaytet](https://community.plotly.com/u/nvaytet)
#### Post date: [February 28, 2020, 1:28pm UTC](https://community.plotly.com/t/interaction-with-ipywidget-slider-is-slow-performance-is-much-lower-than-a-matplotlib-equivalent/31957/5 "2020-02-28T13:28:56Z")
Just in case someone finds it useful:
another example with `pythreejs` showing also a very good performance:
```auto
import pythreejs as p3
import ipywidgets as widgets
import numpy as np
import IPython.display as disp
N = 1000
M = 500
xx = np.linspace(0.0, 12.0, N)
yy = np.linspace(0.0, 6.0, N)
x, y = np.meshgrid(xx, yy)
a = [np.sin(np.sqrt(x **2 + y** 2))]
a.append(np.random.normal(a[0] * 0.1, 0.05))
pts1 = np.zeros([N, 3])
pts1[:, 0] = xx * 0.2
pts1[:, 1] = a[0][:, 0]
arr1 = p3.BufferAttribute(array=pts1)
geometry1 = p3.BufferGeometry(attributes={
'position': arr1,
})
material1 = p3.LineBasicMaterial(color="red", linewidth=4)
line1 = p3.Line(geometry=geometry1,
material=material1)
pts2 = np.zeros([N, 3])
pts2[:, 0] = xx * 0.2
pts2[:, 1] = a[1][:, 0]
arr2 = p3.BufferAttribute(array=pts2)
geometry2 = p3.BufferGeometry(attributes={
'position': arr2,
})
material2 = p3.LineBasicMaterial(color="blue", linewidth=4)
line2 = p3.Line(geometry=geometry2,
material=material2)
width = 800
height= 500
# Create the threejs scene with ambient light and camera
camera = p3.PerspectiveCamera(position=[0, 0, 5],
aspect=width / height)
key_light = p3.DirectionalLight(position=[0, 10, 10])
ambient_light = p3.AmbientLight()
scene = p3.Scene(children=[
line1, line2, camera, key_light, ambient_light])
controller = p3.OrbitControls(controlling=camera)
# Render the scene into a widget
renderer = p3.Renderer(camera=camera, scene=scene,
controls=[controller],
width=width,
height=height)
sl = widgets.IntSlider(
value=0,
min=0,
max=N-1,
step=1,
continuous_update=True,
readout=True)
def update_y(change):
# for i, line in enumerate(ax.lines):
# line.set_ydata(a[i][:, change["new"]])
pts1[:, 1] = a[0][:, change["new"]]
geometry1.attributes["position"].array = pts1
pts2[:, 1] = a[1][:, change["new"]]
geometry2.attributes["position"].array = pts2
sl.observe(update_y, names="value")
disp.display(sl)
renderer
```
