# Insert pie chart on a map
**URL:** https://community.plotly.com/t/insert-pie-chart-on-a-map/63068
**Category:** Dash Python
**Tags:** question
**Created:** [April 15, 2022, 11:52am UTC](https://community.plotly.com/t/insert-pie-chart-on-a-map/63068 "2022-04-15T11:52:50Z")
**Posts on this page:** 5
**Page:** 1
### Author:  [@Francis\_kk](https://community.plotly.com/u/Francis_kk)
#### Post date: [April 15, 2022, 11:52am UTC](https://community.plotly.com/t/insert-pie-chart-on-a-map/63068/1 "2022-04-15T11:52:50Z")
hello everyone,
I would like to know if it is possible to insert several pie charts on a map (you can see an example on the picture). My searchs on the web have been unsuccessful.
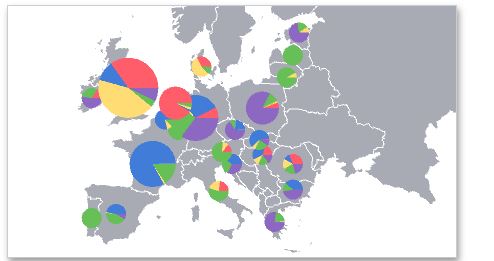
Thank you for your help.
---
### Author:  [@Emil](https://community.plotly.com/u/Emil)
#### Post date: [April 15, 2022, 12:55pm UTC](https://community.plotly.com/t/insert-pie-chart-on-a-map/63068/2 "2022-04-15T12:55:30Z")
You could try mini charts,
[https://dash-leaflet.herokuapp.com/#minichart](https://dash-leaflet.herokuapp.com/#minichart)
---
### Author:  [@Francis\_kk](https://community.plotly.com/u/Francis_kk)
#### Post date: [April 20, 2022, 3:21pm UTC](https://community.plotly.com/t/insert-pie-chart-on-a-map/63068/3 "2022-04-20T15:21:05Z")
Perfect. thanks a lot
---
### Author:  [@kasivasu](https://community.plotly.com/u/kasivasu)
#### Post date: [January 6, 2024, 3:03am UTC](https://community.plotly.com/t/insert-pie-chart-on-a-map/63068/4 "2024-01-06T03:03:35Z")
Greetings,
I have a similar requirement. You have saved me lot of time. The link has changed.
> [@Dash Leaflet Minicharts](https://community.plotly.com/t/dash-leaflet-minicharts/58239):
>
> In dash-leaflet==0.1.23 a new Minichart component has been contributed by @RenaudLN . It makes it easy to draw small, animated charts. I think it looks so cool, so I figured I would share it here smiley [Peek 2021-11-08 18-16] from dash import Dash, Output, Input, dcc import dash\_leaflet as dl # Create example app. app = Dash(update\_title=None) app.layout = dl.Map([ dl.TileLayer(), dl.Minichart(lat=56.1780842, lon=10.1119354, type="bar", id="bar"), dl.Minichart(lat=55.6712474, …
Thank you
---
### Author:  [@PipInstallPython](https://community.plotly.com/u/PipInstallPython)
#### Post date: [January 7, 2024, 6:26pm UTC](https://community.plotly.com/t/insert-pie-chart-on-a-map/63068/5 "2024-01-07T18:26:23Z")
I have an elegant solution that might be helpful, I’m using Custom Pie Chart Cluster and Icons on individual location-based on Leaflet GeoJSON::

```auto
# dash_extentions.javascript import assign
point_to_layer_js = assign("""function(feature, latlng){
const flag = L.icon({iconUrl: `https://cdn.discordapp.com/attachments/419291925322006528/1178069819707359242/mining_site1.png?ex=6574ce04&is=65625904&hm=8c23df4651c5a131cbfb37ee155aa1edd0e7c9608a33f9bcc862df09875396b9&`, iconSize: [64, 48]});
return L.marker(latlng, {icon: flag});
}
""")
cluster_to_layer = assign("""function(feature, latlng, index, context){
function getRandomInt(min, max) {
return Math.floor(Math.random() * (max - min + 1)) + min;
}
function ringSVG(opt) {
function describeArc(opt) {
const innerStart = polarToCartesian(opt.x, opt.y, opt.radius, opt.endAngle);
const innerEnd = polarToCartesian(opt.x, opt.y, opt.radius, opt.startAngle);
const outerStart = polarToCartesian(opt.x, opt.y, opt.radius + opt.ringThickness, opt.endAngle);
const outerEnd = polarToCartesian(opt.x, opt.y, opt.radius + opt.ringThickness, opt.startAngle);
const largeArcFlag = opt.endAngle - opt.startAngle <= 180 ? "0" : "1";
return [ "M", outerStart.x, outerStart.y,
"A", opt.radius + opt.ringThickness, opt.radius + opt.ringThickness, 0, largeArcFlag, 0, outerEnd.x, outerEnd.y,
"L", innerEnd.x, innerEnd.y,
"A", opt.radius, opt.radius, 0, largeArcFlag, 1, innerStart.x, innerStart.y,
"L", outerStart.x, outerStart.y, "Z"].join(" ");
}
const polarToCartesian = (centerX, centerY, radius, angleInDegrees) => {
return { x: centerX + (radius * Math.cos((angleInDegrees - 90) * Math.PI / 180.0)),
y: centerY + (radius * Math.sin((angleInDegrees - 90) * Math.PI / 180.0)) };
}
opt = opt || {};
const defaults = { width: 60, height: 60, radius: 20, gapDeg: 5, goodPerc: 75, fontSize: 17, text: `test`,
ringThickness: 7, goodColor: 'green', badColor: 'red'};
opt = {...defaults, ...opt};
const badPercDeg = 360 * (100 - opt['goodPerc']) / 100;
const stdOpt = {x: opt['width']/2, y: opt['height']/2, radius: opt['radius'], ringThickness: opt['ringThickness']};
const dGreen = describeArc({...stdOpt, startAngle: 90, endAngle: 450 - badPercDeg - opt['gapDeg']});
const dRed = describeArc({...stdOpt, startAngle: 450 - badPercDeg, endAngle: 450 - opt['gapDeg']});
const path1 = `
${path1} ${path2}
${opt['text'] || opt['goodPerc']}
`;
}
/ ********************* /
const {min, max, colorscale, circleOptions, colorProp} = context.hideout;
const csc = chroma.scale(colorscale).domain([min, max]);
// Set color based on mean value of leaves.
const leaves = index.getLeaves(feature.properties.cluster_id);
let valueSum = 0;
for (let i = 0; i < leaves.length; ++i) {
valueSum += leaves[i].properties[colorProp]
}
const valueMean = valueSum / leaves.length;
// icon background color
const scatterIcon = L.DivIcon.extend({
createIcon: function(oldIcon) {
let icon = L.DivIcon.prototype.createIcon.call(this, oldIcon);
return icon;
}
});
// Render a circle with the number of leaves written in the center.
const total = feature.properties.point_count_abbreviated;
const numOffline = getRandomInt(0, total);
const numOnline = total - numOffline;
const goodPerc = numOnline / total * 100;
const icon = new scatterIcon({
html: ringSVG({
text:`${total-numOffline}/${total}`,
goodPerc,
width: 70,
height: 70,
radius: 15,
fontSize: 12,
ringThickness: 5,
}),
className: "marker-cluster",
iconSize: L.point(40, 40),
className: "marker-cluster",
iconSize: L.point(40, 40),
color: csc(valueMean)
});
return L.marker(latlng, {icon : icon})
}
""")
```
GeoJson & map:
```auto
cities = dl.GeoJSON(
data=geobuf,
format='geobuf',
cluster=True,
zoomToBoundsOnClick=True,
superClusterOptions=dict(radius=40),
hideout=dict(
circleOptions=dict(fillOpacity=1, stroke=False, radius=3),
min=0,
),
pointToLayer=point_to_layer_js,
clusterToLayer=cluster_to_layer,
)
dl.Map([
dl.TileLayer(),
cities
],
style={'width': '100%', 'height': '100vh'},
center=[40, -74], # y, x
zoom=7
)
```