Hi @remidm,
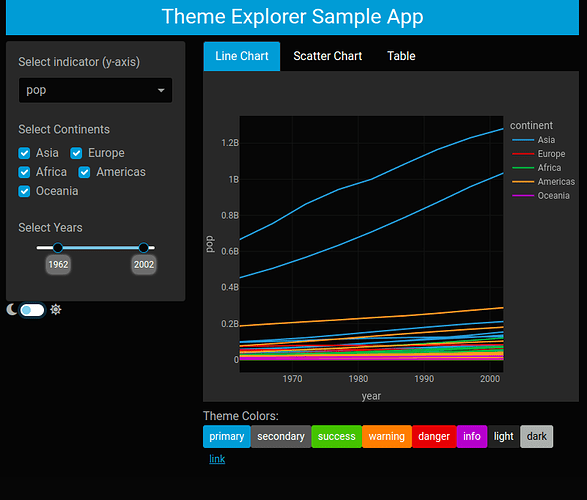
Yes, you can do that. If you set the background with a dark color and use opacity to lighten it, then it will work for both themes. For example, in your outer container you can add:
className=“dbc bg-opacity-10 bg-black”
Note that if you use variable names --bs-body is light in light themes and dark in dark themes.
Here’s the sample app - note it uses the dbc class that updates the dcc components as well. Try running it locally:
from dash import Dash, dcc, html, dash_table, Input, Output, callback
import plotly.express as px
import dash_bootstrap_components as dbc
from dash_bootstrap_templates import ThemeSwitchAIO

# select the Bootstrap stylesheet2 and figure template2 for the theme toggle here:
template_theme1 = "minty"
template_theme2 = "cyborg"
url_theme1 = dbc.themes.MINTY
url_theme2 = dbc.themes.CYBORG

df = px.data.gapminder()
years = df.year.unique()
continents = df.continent.unique()

# stylesheet with the .dbc class
dbc_css = "https://cdn.jsdelivr.net/gh/AnnMarieW/dash-bootstrap-templates/dbc.min.css"

app = Dash(__name__, external_stylesheets=[dbc.themes.BOOTSTRAP, dbc_css])

header = html.H4(
    "Theme Explorer Sample App", className="bg-primary text-white p-2 mb-2 text-center"
)

table = dash_table.DataTable(
    id="table",
    columns=[{"name": i, "id": i, "deletable": True} for i in df.columns],
    data=df.to_dict("records"),
    page_size=10,
    editable=True,
    cell_selectable=True,
    filter_action="native",
    sort_action="native",
    style_table={"overflowX": "auto"},
)

dropdown = html.Div(
    [
        dbc.Label("Select indicator (y-axis)"),
        dcc.Dropdown(
            ["gdpPercap", "lifeExp", "pop"],
            "pop",
            id="indicator",
            clearable=False,
        ),
    ],
    className="mb-4",
)

checklist = html.Div(
    [
        dbc.Label("Select Continents"),
        dbc.Checklist(
            id="continents",
            options=[{"label": i, "value": i} for i in continents],
            value=continents,
            inline=True,
        ),
    ],
    className="mb-4",
)

slider = html.Div(
    [
        dbc.Label("Select Years"),
        dcc.RangeSlider(
            years[0],
            years[-1],
            5,
            id="years",
            marks=None,
            tooltip={"placement": "bottom", "always_visible": True},
            value=[years[2], years[-2]],
        ),
    ],
    className="mb-4",
)
theme_colors = [
    "primary",
    "secondary",
    "success",
    "warning",
    "danger",
    "info",
    "light",
    "dark",
    "link",
]
colors = html.Div(
    [dbc.Button(f"{color}", color=f"{color}", size="sm") for color in theme_colors]
)
colors = html.Div(["Theme Colors:", colors], className="my-2")


controls = dbc.Card(
    [dropdown, checklist, slider],
    body=True,
)

tab1 = dbc.Tab([dcc.Graph(id="line-chart")], label="Line Chart")
tab2 = dbc.Tab([dcc.Graph(id="scatter-chart")], label="Scatter Chart")
tab3 = dbc.Tab([table], label="Table", className="p-4")
tabs = dbc.Tabs([tab1, tab2, tab3])

app.layout = dbc.Container(
    [
        header,
        dbc.Row(
            [
                dbc.Col(
                    [
                        controls,
                        ThemeSwitchAIO(aio_id="theme", themes=[url_theme1, url_theme2])
                    ],
                    width=4,
                ),
                dbc.Col([tabs, colors], width=8),
            ]
        ),
    ],
    fluid=True,
    className="dbc bg-opacity-10  bg-black mb-4",
)


@callback(
    Output("line-chart", "figure"),
    Output("scatter-chart", "figure"),
    Output("table", "data"),
    Input("indicator", "value"),
    Input("continents", "value"),
    Input("years", "value"),
    Input(ThemeSwitchAIO.ids.switch("theme"), "value"),
)
def update_line_chart(indicator, continent, yrs, toggle):
    if continent == [] or indicator is None:
        return {}, {}, []

    dff = df[df.year.between(yrs[0], yrs[1])]
    dff = dff[dff.continent.isin(continent)]
    data = dff.to_dict("records")

    fig = px.line(
        dff,
        x="year",
        y=indicator,
        color="continent",
        line_group="country",
        template=template_theme1 if toggle else template_theme2
    )

    fig_scatter = px.scatter(
        df.query(f"year=={yrs[1]} & continent=={continent}"),
        x="gdpPercap",
        y="lifeExp",
        size="pop",
        color="continent",
        log_x=True,
        size_max=60,
        template=template_theme1 if toggle else template_theme2
    )

    return fig, fig_scatter, data


if __name__ == "__main__":
    app.run_server(debug=True)

