Exporting multi page Dash app to pdf with entire layout

Yes! You will need an additional package on top of PDFkit and Blob-stream called HTML2Canvas (https://cdnjs.cloudflare.com/ajax/libs/html2canvas/0.4.1/html2canvas.min.js) in the assets folder. You can convert any DIV and anything inside it to an image then use PDFKit to put the image in a pdf. However it is not as reliable as the first method since it takes a screenshot of a div.

import dash_table
import pandas as pd
import dash
import dash_html_components as html
from dash.dependencies import Input, Output

df = pd.read_csv('https://raw.githubusercontent.com/plotly/datasets/master/solar.csv')

app = dash.Dash(__name__)

app.layout = html.Div([
    html.Button(id='button', children='Print Dash DataTable'),
    html.Div([
        dash_table.DataTable(
            id='table',
            columns=[{"name": i, "id": i} for i in df.columns],
            data=df.to_dict('records'),
        ),
    ], id='table_div'),
    html.Div(id='img_div')
    ])


app.clientside_callback(
    '''
    function (n_clicks) {
        if (n_clicks > 0) {
            html2canvas(document.getElementById('table_div')).then(function(canvas) {
                var img = new Image();
                var height = canvas.height;
                img.src = canvas.toDataURL("image/png");
                document.getElementById('img_div').appendChild(img);

                var doc = new PDFDocument({layout:'portrait', margin: 25});
                var stream = doc.pipe(blobStream());

                var img_container = document.getElementById('img_div');
                var imgElement = img_container.getElementsByTagName('img');
                var imgSrc = imgElement[imgElement.length - 1].src;
                doc.image(imgSrc, {width: 600});

                doc.end();

                var saveData = (function () {
                    var a = document.createElement("a");
                    document.body.appendChild(a);
                    a.style = "display: none";
                    return function (blob, fileName) {
                        var url = window.URL.createObjectURL(blob);
                        a.href = url;
                        a.download = fileName;
                        a.click();
                        window.URL.revokeObjectURL(url);
                    };
                }());

                stream.on('finish', function() {
                  var blob = stream.toBlob('application/pdf');
                  saveData(blob, 'Dash_DataTable.pdf');
                });
            });


        }
        return false;
    }
    ''',
    Output('button', 'disabled'),
    [
        Input('button', 'n_clicks'),
    ]
)


if __name__ == '__main__':
    app.run_server(debug=True)

A downside of this method is I haven’t been able to add more than one screenshot of a div to the pdf, so if you have multiple charts/tables you need to wrap everything to a div and screenshot that div to the pdf. If the div goes beyond A4 size then you need to make the pdf longer.
2 Likes

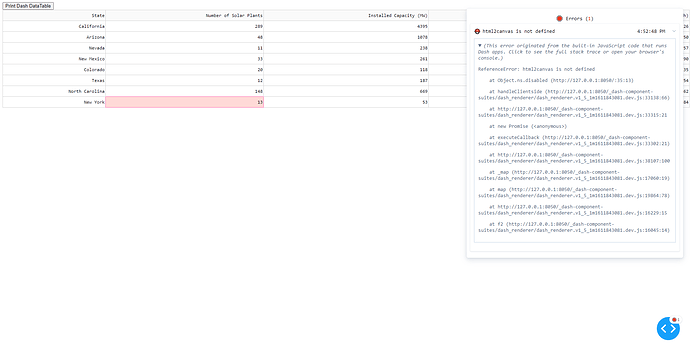
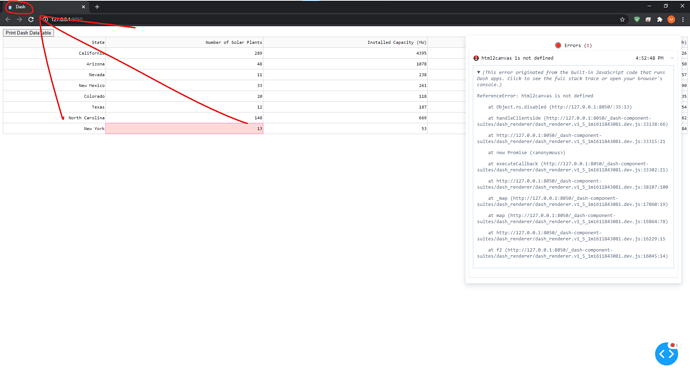
@philphi I’ve added html2canvas.min.js to assets folder but it still shows error ‘html2canvas is not defined’

Similar to kabure’s issue above it cannot see the JS files. Make sure the assets folder is in the same directory as the python file you use for the example code.

Yes, I’ve put python file in same folder as assets and also favicon.ico is working

I’m not sure what the issue is then. Try empty cache and rerun the program or get the latest html2canvas.js file or create a new folder with just the example code and assets folder with the necessary js files.

worked for me when i downloaded the html2canvas files from below link:

Hey I am Sarvesh I am Working On Two Python FrameWork Django and Dash Plotly, While I am working on Project There is Task to generate Pdf I Try and Found Solution On That. Hope The Solution will Found usefull to all
import pandas as pd

import datetime as dt

import plotly.offline as pyo

import plotly.graph_objs as go

import plotly.express as px

import dash_table

import dash_core_components as dcc

import dash_html_components as html

import dash_bootstrap_components as dbc

from dash.dependencies import Input, Output, State

from django_plotly_dash import DjangoDash

labels = [‘Oxygen’,‘Hydrogen’,‘Carbon_Dioxide’,‘Nitrogen’]

values = [4500, 2500, 1053, 500]

app = DjangoDash(‘Report’,add_bootstrap_links=True)

app.css.append_css({ “external_url” : “/static/assets/css/dashstyle.css” })

html.Script(src=‘https://cdnjs.cloudflare.com/ajax/libs/html2pdf.js/0.9.2/html2pdf.bundle.js’)

card1 = dbc.Card([

dcc.Checklist(

     options=[{'label':'Top Five Highest Frequent Customers',}],

     className='printCheckBox',

     labelStyle={'fontWeight':'600',},

     inputStyle={'marginRight':'10px',},

     inputClassName='chkremove',

     id = 'clist'

 ),

dbc.CardBody([

    html.P(['2 His Majesties Letter to the Lord Thresurer & other of the Lords to deliver the Charge of the Tower & Prisones thereunto S.r Wm Wade Knight which was done by the Earle of Dorsett and the Earle of Devonshire on Thursday in the Afternoon, at the Clock being the 15 of Aug. 1605'])

])

],className=‘cardDesign’)

card2 = dbc.Card([

dbc.CardBody([

           dcc.Graph(figure=dict(

               data=[go.Pie(labels=labels,values=values)],

               layout=dict(autosize=True)

           ),

           responsive=True,

           )

])        

],className=‘cardDesign’)

card2_1 = dbc.Card([

dbc.CardBody([

           dcc.Graph(figure=dict(

               data=[go.Pie(labels=labels,values=values)]

           ))

])

],className=‘cardDesign’)

card2_2 = dbc.Card([

dbc.CardBody([

           dcc.Graph(figure=dict(

               data=[go.Pie(labels=labels,values=values)]

           ))

])

],className=‘cardDesign’)

card3 = dbc.Card([

dcc.Checklist(

     options=[{'label':'Top Five Highest Frequent Customers',}],

     className='printCheckBox',

     labelStyle={'fontWeight':'600',},

     inputStyle={'marginRight':'10px',},

     inputClassName='chkremove',

     id = 'clist'

 ),

dbc.CardBody([

           dcc.Graph(figure=dict(

               data=[go.Bar(x=labels,y=values)]

           ))

])        

],className=‘cardDesign’)

app.layout = html.Div([

html.Div([

    dbc.Row([

        dbc.Col([

            html.H3(['Report PDF Generator'])

        ]),

    ]),

    dbc.Row([

        dbc.Col([

            card1

        ]),

    ]),

    dbc.Row([

        dbc.Col([

            card2

        ]),

    ]),

    dbc.Row([

    dbc.Col([

        dbc.Row([

            dbc.Col([card2_1],xs=12, sm=12, md=12, lg=6, xl=6),

            dbc.Col([card2_2],xs=12, sm=12, md=12, lg=6, xl=6),

        ])

    ]),

]),

dbc.Row([

        dbc.Col([

            card2

        ]),

    ]),

dbc.Row([

    dbc.Col([

        dbc.Row([

            dbc.Col([card2_1],xs=12, sm=12, md=12, lg=6, xl=6),

            dbc.Col([card2_2],xs=12, sm=12, md=12, lg=6, xl=6),

        ])

    ]),

]),

dbc.Row([

        dbc.Col([

            card3

        ]),

    ]),

],id='print'),

html.H1(id='h'),

dbc.Button(children=['Download'],className="mr-1",id='js',n_clicks=0),

html.Script(src="https://code.jquery.com/jquery-3.5.1.slim.min.js",integrity="sha384-DfXdz2htPH0lsSSs5nCTpuj/zy4C+OGpamoFVy38MVBnE+IbbVYUew+OrCXaRkfj",crossOrigin='anonymous'),

html.Script(src="https://cdn.jsdelivr.net/npm/bootstrap@4.5.3/dist/js/bootstrap.bundle.min.js",integrity="sha384-ho+j7jyWK8fNQe+A12Hb8AhRq26LrZ/JpcUGGOn+Y7RsweNrtN/tE3MoK7ZeZDyx",crossOrigin='anonymous'),

html.Script(src="https://cdnjs.cloudflare.com/ajax/libs/html2pdf.js/0.8.1/html2pdf.bundle.min.js")

],id=‘main’)

app.clientside_callback(

"""

function(n_clicks){

    if(n_clicks > 0){

        $('.chkremove').hide();

        var opt = {

            margin: 2,

            filename: 'myfile.pdf',

            image: { type: 'jpeg', quality: 0.98 },

            html2canvas: { scale: 1},

            jsPDF: { unit: 'cm', format: 'a2', orientation: 'p' },

            pagebreak: { mode: ['avoid-all'] }

        };

        html2pdf().from(document.getElementById("print")).set(opt).save();

        setTimeout(function(){

            $('.chkremove').show();

        },2000);

    }

}

""",

Output('js','n_clicks'),

Input('js','n_clicks')

)

Hi @Sarvesh04

I am having difficulties copying your code to try it out.

Can you please insert it as a code? also what else have you used in the Asset folder (and where to download them? ).

Regards

@Basheerkafaf i used asset folder only for css purpose

import pandas as pd 
import datetime as dt

import plotly.offline as pyo 
import plotly.graph_objs as go 
import plotly.express as px


import dash_table
import dash_core_components as dcc 
import dash_html_components as html 
import dash_bootstrap_components as dbc

from dash.dependencies import Input, Output, State
from django_plotly_dash import DjangoDash


labels = ['Oxygen','Hydrogen','Carbon_Dioxide','Nitrogen']
values = [4500, 2500, 1053, 500]

app = DjangoDash('Report',add_bootstrap_links=True)
app.css.append_css({ "external_url" : "/static/assets/css/dashstyle.css" })

html.Script(src='https://cdnjs.cloudflare.com/ajax/libs/html2pdf.js/0.9.2/html2pdf.bundle.js')

card1 = dbc.Card([
    dcc.Checklist(
         options=[{'label':'Top Five Highest Frequent Customers',}],
         className='printCheckBox',
         labelStyle={'fontWeight':'600',},
         inputStyle={'marginRight':'10px',},
         inputClassName='chkremove',
     ),
    dbc.CardBody([
        html.P(['2 His Majesties Letter to the Lord Thresurer & other of the Lords to deliver the Charge of the Tower & Prisones thereunto S.r Wm Wade Knight which was done by the Earle of Dorsett and the Earle of Devonshire on Thursday in the Afternoon, at the Clock being the 15 of Aug. 1605'])
    ])
],className='cardDesign')

card2 = dbc.Card([
    dcc.Checklist(
         options=[{'label':'Top Five Highest Frequent Customers',}],
         className='printCheckBox',
         labelStyle={'fontWeight':'600',},
         inputStyle={'marginRight':'10px',},
         inputClassName='chkremove',
     ),
    dbc.CardBody([
               dcc.Graph(figure=dict(
                   data=[go.Pie(labels=labels,values=values)],
                   layout=dict(autosize=True)
               ),
               responsive=True,
               )
    ])        
],className='cardDesign')

card2_1 = dbc.Card([
    dbc.CardBody([
               dcc.Graph(figure=dict(
                   data=[go.Pie(labels=labels,values=values)]
               ))
    ])
 ],className='cardDesign')

card2_2 = dbc.Card([
    dbc.CardBody([
               dcc.Graph(figure=dict(
                   data=[go.Pie(labels=labels,values=values)]
               ))
    ])
 ],className='cardDesign')

card3 = dbc.Card([
    dcc.Checklist(
         options=[{'label':'Top Five Highest Frequent Customers',}],
         className='printCheckBox',
         labelStyle={'fontWeight':'600',},
         inputStyle={'marginRight':'10px',},
         inputClassName='chkremove',
     ),
    dbc.CardBody([
               dcc.Graph(figure=dict(
                   data=[go.Bar(x=labels,y=values)]
               ))
    ])        
],className='cardDesign')

app.layout = html.Div([
    html.Div([

        dbc.Row([
            dbc.Col([
                html.H3(['Report PDF Generator'])
            ]),
        ]),

        dbc.Row([
            dbc.Col([
                card1
            ]),
        ]),

        dbc.Row([
            dbc.Col([
                card2
            ]),
        ]),

        dbc.Row([
        dbc.Col([
            dbc.Row([
                dbc.Col([card2_1],xs=12, sm=12, md=12, lg=6, xl=6),
                dbc.Col([card2_2],xs=12, sm=12, md=12, lg=6, xl=6),
            ])
        ]),
    ]),

    dbc.Row([
            dbc.Col([
                card2
            ]),
        ]),
   dbc.Row([
        dbc.Col([
            dbc.Row([
                dbc.Col([card2_1],xs=12, sm=12, md=12, lg=6, xl=6),
                dbc.Col([card2_2],xs=12, sm=12, md=12, lg=6, xl=6),
            ])
        ]),
    ]),

    dbc.Row([
            dbc.Col([
                card3
            ]),
        ]),


    ],id='print'),
    html.H1(id='h'),
    dbc.Button(children=['Download'],className="mr-1",id='js',n_clicks=0),
    html.Script(src="https://code.jquery.com/jquery-3.5.1.slim.min.js",integrity="sha384-DfXdz2htPH0lsSSs5nCTpuj/zy4C+OGpamoFVy38MVBnE+IbbVYUew+OrCXaRkfj",crossOrigin='anonymous'),
    html.Script(src="https://cdn.jsdelivr.net/npm/bootstrap@4.5.3/dist/js/bootstrap.bundle.min.js",integrity="sha384-ho+j7jyWK8fNQe+A12Hb8AhRq26LrZ/JpcUGGOn+Y7RsweNrtN/tE3MoK7ZeZDyx",crossOrigin='anonymous'),
    html.Script(src="https://cdnjs.cloudflare.com/ajax/libs/html2pdf.js/0.8.1/html2pdf.bundle.min.js")

],id='main')

app.clientside_callback(
    """
    function(n_clicks){
        if(n_clicks > 0){
            $('.chkremove').hide();
            var opt = {
                margin: 2,
                filename: 'myfile.pdf',
                image: { type: 'jpeg', quality: 0.98 },
                html2canvas: { scale: 1},
                jsPDF: { unit: 'cm', format: 'a2', orientation: 'p' },
                pagebreak: { mode: ['avoid-all'] }
            };
            html2pdf().from(document.getElementById("print")).set(opt).save();
            setTimeout(function(){
                $('.chkremove').show();
            },2000);
        }
    }
    """,
    Output('js','n_clicks'),
    Input('js','n_clicks')
)

my css from asset folder

@import url('https://fonts.googleapis.com/css2?family=Montserrat:wght@300;400;600;700&display=swap');

.main{
    font-family: 'Montserrat', sans-serif;
  }

  .cardDesign{
    box-shadow:0 4px 8px 0 rgba(0, 0, 0, 0.2);
    margin-top: 5px;
    margin-bottom: 5px;
}

.printCheckBox{
  margin-left:8px;
  margin-top: 5px;
}
1 Like

I will try to do in proper in dash framework since In above code i used both framework and merge them

@Basheerkafaf I have generated pdf using proper Dash Framework
python code

import pandas as pd 
import datetime as dt

import plotly.offline as pyo 
import plotly.graph_objs as go 
import plotly.express as px

import dash
import dash_core_components as dcc 
import dash_html_components as html 
import dash_bootstrap_components as dbc

from dash.dependencies import Input, Output, State

labels = ['Oxygen','Hydrogen','Carbon_Dioxide','Nitrogen']
values = [4500, 2500, 1053, 500]

app = dash.Dash(__name__,external_stylesheets=[dbc.themes.BOOTSTRAP])

card1 = dbc.Card([
    dbc.CardBody([
        html.P(['2 His Majesties Letter to the Lord Thresurer & other of the Lords to deliver the Charge of the Tower & Prisones thereunto S.r Wm Wade Knight which was done by the Earle of Dorsett and the Earle of Devonshire on Thursday in the Afternoon, at the Clock being the 15 of Aug. 1605'],
                className = "narrative"
            )
    ])
],className='cardDesign')

card2 = dbc.Card([
    dbc.CardBody([
               dcc.Graph(figure=dict(
                   data=[go.Pie(labels=labels,values=values)],
                   layout=dict(autosize=True)
               ),
               responsive=True,
               )
    ])        
],className='cardDesign')


card2_1 = dbc.Card([
    dbc.CardBody([
               dcc.Graph(figure=dict(
                   data=[go.Pie(labels=labels,values=values)]
               ))
    ])
 ],className='cardDesign')

card2_2 = dbc.Card([
    dbc.CardBody([
               dcc.Graph(figure=dict(
                   data=[go.Pie(labels=labels,values=values)]
               ))
    ])
 ],className='cardDesign')

card3 = dbc.Card([
    dbc.CardBody([
               dcc.Graph(figure=dict(
                   data=[go.Bar(x=labels,y=values)]
               ))
    ])        
],className='cardDesign')

app.layout = html.Div([
    html.Div([
        dbc.Row([
            dbc.Col([
                html.H3(['Report PDF Generator'])
            ]),
        ]),

        dbc.Row([
            dbc.Col([
                card1
            ],id="col1"),
        ]),

        dbc.Row([
            dbc.Col([
                card2
            ],id="col2"),
        ]),

        dbc.Row([
        dbc.Col([
            dbc.Row([
                dbc.Col([card2_1],xs=12, sm=12, md=12, lg=6, xl=6,id="col3"),
                dbc.Col([card2_2],xs=12, sm=12, md=12, lg=6, xl=6,id="col4"),
            ])
        ]),
    ]),

        dbc.Row([
            dbc.Col([
                card3
            ],id="col5"),
        ]),
    ],id='print'),
    dbc.Button(children=['Download'],className="mr-1",id='js',n_clicks=0),
],id='main',)

app.clientside_callback(
    """
    function(n_clicks){
        if(n_clicks > 0){
            var opt = {
                margin: 1,
                filename: 'myfile.pdf',
                image: { type: 'jpeg', quality: 0.98 },
                html2canvas: { scale: 3},
                jsPDF: { unit: 'cm', format: 'a2', orientation: 'p' },
                pagebreak: { mode: ['avoid-all'] }
            };
            html2pdf().from(document.getElementById("print")).set(opt).save();
        }
    }
    """,
    Output('js','n_clicks'),
    Input('js','n_clicks')
)

if __name__ == '__main__':
    app.run_server(port='8050',debug=True)

js code

function addScript(url) {
    var script = document.createElement('script');
    script.type = 'application/javascript';
    script.src = url;
    document.head.appendChild(script);
}
addScript('https://raw.githack.com/eKoopmans/html2pdf/master/dist/html2pdf.bundle.js');

css code

@import url('https://fonts.googleapis.com/css2?family=Montserrat:wght@300;400;600;700&display=swap');

#main{
    font-family: 'Montserrat', sans-serif;
  }

.cardDesign{
    box-shadow:0 4px 8px 0 rgba(0, 0, 0, 0.2);
    margin-top: 5px;
    margin-bottom: 5px;
}

1 Like

Has anyone had success adding multiple divs here to screenshot?

1 Like

Hi @Sarvesh04 and everyone here

Thanks for sharing! I tried it on my computer and I have the following error message:
“Can’t find variable: html2pdf”

Here is the detail:

http://127.0.0.1:8050/:48:21

handleClientside

_callee$

c@http://127.0.0.1:8050/_dash-component-suites/dash_bootstrap_components/_components/dash_bootstrap_components.v1_0_2m1640803534.min.js:14:4855

http://127.0.0.1:8050/_dash-component-suites/dash_bootstrap_components/_components/dash_bootstrap_components.v1_0_2m1640803534.min.js:14:4605

asyncGeneratorStep

_next

Promise@[native code]

executeCallback

_map

_callee2$

c@http://127.0.0.1:8050/_dash-component-suites/dash_bootstrap_components/_components/dash_bootstrap_components.v1_0_2m1640803534.min.js:14:4855

http://127.0.0.1:8050/_dash-component-suites/dash_bootstrap_components/_components/dash_bootstrap_components.v1_0_2m1640803534.min.js:14:4605

asyncGeneratorStep

_next

Promise@[native code]

forEach

dispatch

_callee$

c@http://127.0.0.1:8050/_dash-component-suites/dash_bootstrap_components/_components/dash_bootstrap_components.v1_0_2m1640803534.min.js:14:4855

http://127.0.0.1:8050/_dash-component-suites/dash_bootstrap_components/_components/dash_bootstrap_components.v1_0_2m1640803534.min.js:14:4605

asyncGeneratorStep

_next

promiseReactionJob@[native code]

Do you know what can be the origin of this error?
Do you put the js code in a separated file and if so, how do you link it to the python code?

1 Like