Hi I used the last example from Typing and User Input Processing | Dash for Python Documentation | Plotly
to try format my dash data table to 3.d.p. However when I run my code the formatting seems to have no impact on the datatable. Any advice would be appreciated.
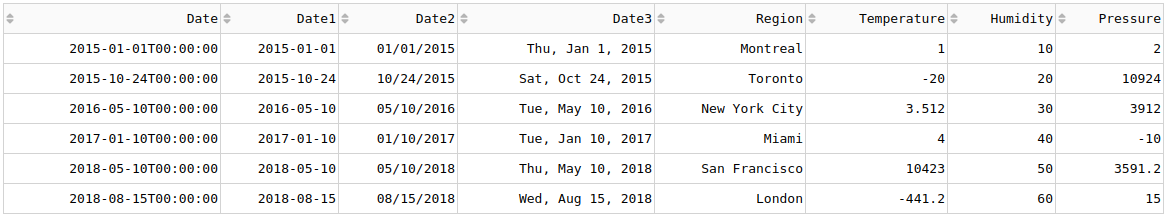
This is the datasheet I have been using
Thanks!
import base64
import io
from flask import Flask
import dash
from dash.dependencies import Input, Output, State
import dash_core_components as dcc
import dash_html_components as html
import dash_table
from dash_table.Format import Format, Scheme
import pandas as pd
import plotly.graph_objs as go
external_stylesheets = ['https://codepen.io/chriddyp/pen/bWLwgP.css']
server = Flask(__name__)
app = dash.Dash(external_stylesheets=external_stylesheets, server=server)
SUP = str.maketrans("0123456789", "⁰¹²³⁴⁵⁶⁷⁸⁹")
app.layout = html.Div([ dcc.Upload(
id='data-table-upload',
children=html.Div([html.Button('Upload File')],
style={'width': '49%', 'height': "60px", 'borderWidth': '1px',
'borderRadius': '5px',
'textAlign': 'center',
}),
multiple=False
),html.Div([html.Div([dash_table.DataTable(id='data-table-interact',
editable=True,
# doesnt do anything fix
columns=[dict(type='numeric',
format=Format(precision=3,
scheme=Scheme.fixed))],
filter_action='native',
sort_action='native',
sort_mode='multi',
selected_columns=[],
selected_rows=[],
page_action='native',
column_selectable='single',
page_current=0,
page_size=20,
style_data={'height': 'auto'},
style_table={'overflowX': 'scroll',
'maxHeight': '300px',
'overflowY': 'scroll'},
style_cell={
'minWidth': '0px', 'maxWidth': '220px',
'whiteSpace': 'normal',
}
),
html.Div(id='data-table-container'), ], style={'padding': 15}),
html.Div([html.Div([
html.Label(["Select X variable:",
(dcc.Dropdown(id='xaxis', placeholder="Select an option for X",
multi=False))
], className="six columns",
style={'fontSize': 14, 'font-family': 'Arial',
'width': '20%', 'display': 'inline-block', 'padding': 5
})
]),
html.Div([
html.Label(["Select Y variable:",
(dcc.Dropdown(id='yaxis',
placeholder="Select an option for Y",
multi=False))
], className="six columns",
style={'fontSize': 14, 'font-family': 'Arial',
'width': '20%',
'display': 'inline-block', 'padding': 5
})
]),
html.Div([
html.Label(["Select size variable:",
(dcc.Dropdown(id='saxis',
placeholder="Select an option for size",
multi=False))],
className="six columns",
style={'fontSize': 14, 'font-family': 'Arial',
'width': '20%',
'display': 'inline-block', 'padding': 5}
)
]),
html.Div([
html.Label(["Select color variable:",
(dcc.Dropdown(id='caxis',
placeholder="Select an option for color",
multi=False))
], className="six columns",
style={'fontSize': 14, 'font-family': 'Arial',
'width': '20%',
'display': 'inline-block', 'padding': 5
})
]),
],
style={'padding-left': '15%', 'padding-right': '5%'}
),
html.Div([html.Label(["Select X axis scale:",
dcc.RadioItems(
id='xaxis-type',
options=[{'label': i, 'value': i} for i in
['Linear', 'Log']],
value='Linear',
labelStyle={'display': 'inline-block'}
)]),
], style={'display': 'inline-block', 'width': '33%'}),
html.Div([html.Label(["Select Y axis scale:",
dcc.RadioItems(
id='yaxis-type',
options=[{'label': i, 'value': i} for i in
['Linear', 'Log']],
value='Linear',
labelStyle={'display': 'inline-block'}
)]),
], style={'display': 'inline-block', 'width': '33%'}),
html.Div([html.Label(["Select color scale:",
dcc.RadioItems(
id='colorscale',
options=[{'label': i, 'value': i} for i in
['Viridis', 'Plasma']],
)])
], style={'display': 'inline-block', 'width': '33%', 'padding': 5}),
app.css.append_css({
'external_url': 'https://codepen.io/chriddyp/pen/bWLwgP.css'
})
], style={'backgroundColor': '#ffffff'})
])
def parse_contents(contents, filename):
content_type, content_string = contents.split(',')
decoded = base64.b64decode(content_string)
try:
if 'csv' in filename:
# Assume that the user uploaded a CSV file
df = pd.read_csv(io.StringIO(decoded.decode('utf-8')))
elif 'xls' in filename:
# Assume that the user uploaded an excel file
df = pd.read_excel(io.BytesIO(decoded))
elif 'txt' or 'tsv' in filename:
df = pd.read_csv(io.StringIO(decoded.decode('utf-8')), delimiter=r'\s+'
)
except Exception as e:
print(e)
return html.Div([
'There was an error processing this file.'
])
return df
# POPULATE X AXIS DROPDOWN SCATTER
@app.callback(Output('xaxis', 'options'),
[Input('data-table-upload', 'contents')],
[State('data-table-upload', 'filename')])
def populate_xaxis_dropdown(contents, filename):
df = parse_contents(contents, filename)
return [{'label': i, 'value': i} for i in df.columns]
# POPULATE Y AXIS DROPDOWN SCATTER
@app.callback(Output('yaxis', 'options'),
[Input('data-table-upload', 'contents')],
[State('data-table-upload', 'filename')])
def populate_yaxis_dropdown(contents, filename):
df = parse_contents(contents, filename)
return [{'label': i, 'value': i} for i in df.columns]
# POPULATE C AXIS DROPDOWN SCATTER
@app.callback(Output('caxis', 'options'),
[Input('data-table-upload', 'contents')],
[State('data-table-upload', 'filename')])
def populate_caxis_dropdown(contents, filename):
df = parse_contents(contents, filename)
return [{'label': i, 'value': i} for i in df.columns]
# POPULATE S AXIS DROPDOWN SCATTER
@app.callback(Output('saxis', 'options'),
[Input('data-table-upload', 'contents')],
[State('data-table-upload', 'filename')])
def populate_saxis_dropdown(contents, filename):
df = parse_contents(contents, filename)
return [{'label': i, 'value': i} for i in df.columns]
@app.callback([Output('data-table-interact', 'data'),
Output('data-table-interact', 'columns')],
[Input('data-table-upload', 'contents')],
[State('data-table-upload', 'filename')])
def update_output(contents, filename):
if contents is None:
return [{}], []
df = parse_contents(contents, filename)
data = df.to_dict('records')
columns = [{"name": i, "id": i, "deletable": True, "selectable": True} for i in df.columns]
return data, columns
@app.callback(Output('data-table-container', 'children'),
[Input('data-table-interact', 'data'),
Input('data-table-interact', 'derived_virtual_data'),
Input('data-table-interact', 'derived_virtual_selected_rows'),
Input('xaxis', 'value'),
Input('yaxis', 'value'),
Input('caxis', 'value'),
Input('saxis', 'value'),
Input('xaxis-type', 'value'),
Input('yaxis-type', 'value'),
Input('colorscale', 'value')
])
def update_figure(rows, derived_virtual_data, derived_virtual_selected_rows, xaxis_name, yaxis_name,
marker_color, marker_size, xaxis_type, yaxis_type, colorscale):
df = pd.DataFrame(rows)
if derived_virtual_selected_rows is None:
return []
dff = df if derived_virtual_data is None else pd.DataFrame(derived_virtual_data)
return [
html.Div([dcc.Graph(id='HTS-graph',
figure={'data': [
go.Scatter(x=dff[xaxis_name], y=dff[yaxis_name],
mode='markers',
marker_color=dff[marker_color],
marker_size=dff[marker_size],
marker=dict(sizemode='area', sizeref=max(dff[marker_size]) / (15 ** 2),
sizemin=4,
opacity=0.7, showscale=True,
line=dict(width=0.7, color='DarkSlateGrey'),
colorbar=dict(title=dict(text=marker_color.translate(SUP),
font=dict(family='Helvetica'),
side='right')),
colorscale="Viridis" if colorscale == 'Viridis' else "Plasma"),
text=dff[df.columns[0]],
hoverinfo=['x', 'y', 'text', 'name'],
# hovertemplate=
# "<b>%{text}</b><br><br>" +
# "%{yaxis_name}: %{y:.0f}<br>" +
# "X Variable: %{x:. }<br>"
# "S Variable : %{marker.size:. }<br>" +
# "C Variable: %{marker.color:.}"
# "<extra></extra>",
)],
'layout': go.Layout(
font={'family': 'Helvetica', 'size': 14},
xaxis={'title': xaxis_name.translate(SUP), 'autorange': True,
'mirror': True,
'ticks': 'outside',
'showline': True,
'showspikes': True,
'type': 'linear' if xaxis_type == 'Linear' else 'log'
},
yaxis={'title': yaxis_name.translate(SUP), 'autorange': True,
'mirror': True,
'ticks': 'outside',
'showline': True,
'showspikes': True,
'type': 'linear' if yaxis_type == 'Linear' else 'log'
},
title="",
template="simple_white",
margin={'l': 50, 'b': 60, 't': 70, 'r': 50},
hovermode='closest',
),
},
)
], style={'textAlign': 'center', 'padding': 25, 'width': '50%', 'height': '100%',
'horizontal-align': 'middle',
'padding-left': '25%', 'padding-right': '25%'
})
for column in [xaxis_name] if column in dff
for column in [yaxis_name] if column in dff
for column in [marker_color] if column in dff
for column in [marker_size] if column in dff
]
if __name__ == '__main__':
app.run_server()

 Glad it worked - Thanks for letting me know.

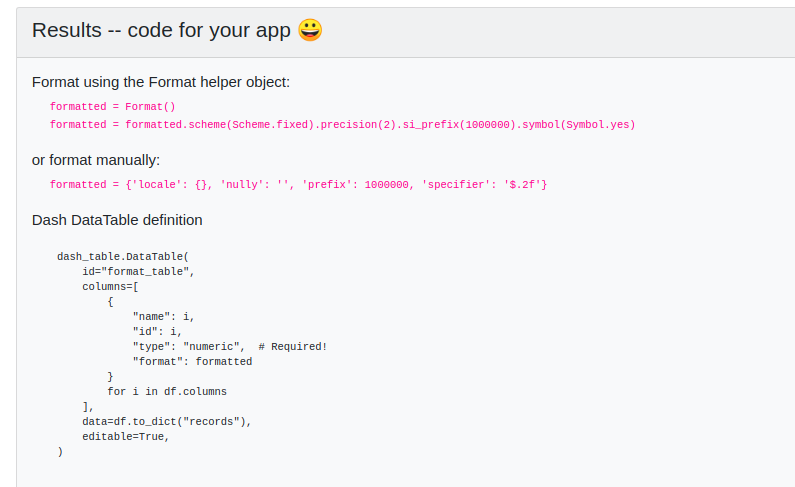
 . I think this should work: